• The economies in Texas are as different as the terrain that spans the state's 270,000 square miles.
    • Big D still stands for diversity, but the tech sector stood out as an expanding industry in 2016.
    • Houston's supporting office industries are completing most of the deals in the market, with legal being one of the most active occupiers.
    • Austin's established tech engine keeps gaining speed with a year-over-year increase in activity in 2016.

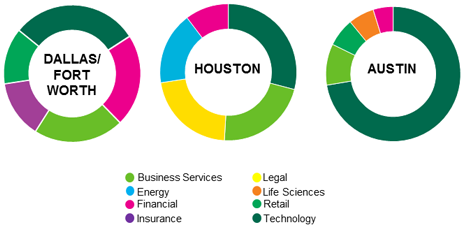
Top 50 Office Lease Transactions in 2016 by Industry*

*Represents the top five industries for each market and excludes any transactions categorized as "other".
Source: CBRE Research, Q4 2016.

Tech industry grows amid DFW's expanding economy
Dallas/Fort Worth is known for its diverse economy that is largely tied to national economic movement rather than one sector in particular. However, as an expanding tech market, it was technology that topped the industry list for large leases in 2016. Between 2015 and 2016, leasing activity among tech companies rose an astounding 333% and also claimed the top lease for 2016. Insurance, a key industry in DFW throughout the current cycle, declined in 2016, but mainly due to Liberty Mutual’s 900,000 sq. ft. lease overshadowing all others in 2015.
 
The suburbs continue to see more sizeable transactions due to higher availability for big blocks of space. Las Colinas and Far North Dallas claimed 42% and 25%, respectively, of DFW’s top 50 transactions of 2016. The North Texas office sector remained a crucial component of the national market with 11% of all U.S. 2016 office absorption attributed to the DFW market.


The big shift: Houston's office occupier demand diversifies
Sentiment is changing in the Energy Capital of the World as oil prices dance around $55/bbl and sublease glut backs off. Yet, 2016 was saddled with a significant decline in demand in the largest office-occupying sector—energy. The top four leases of 2016, totaling 1 million sq. ft., were non-energy tenants in new or under construction buildings. Compare that with 2015 when the top four leases were energy-related renewals; energy only accounted for 18% of leasing activity last year, down from 52% from 2012-2014. Legal is picking up the slack with its share of leasing activity nearly doubling over 2015 volumes, due largely to national law firms opening new Houston offices.

Tech continues to power up Austin office
As unemployment hovered around 3%, tenant demand remained robust in the Live Music Capital during 2016. Sustained occupier demand has kept the vacancy rate below 10% in the Central Business District (7.8%), Northwest (8.8%) and Southwest (9.7%) submarkets. In the suburban submarkets, local, national and international companies are focusing efforts on sprawling corporate campuses to attract top talent—which isn’t difficult for Austin. Of the top 10 leases in 2016, six came from international tech companies expanding their presence in Austin and taking space in newly constructed buildings (totaling approximately 869,000 sq. ft.). While the Austin office market is known for tech, activity in 2016 was even higher than 2015, where only four of the top leases came from tech companies, totaling approximately 563,000 sq. ft. 


DOWNLOAD
THE MARKETFLASH

Robert Kramp 
Director of Research and Analysis - Texas-Oklahoma-Arkansas Region
T 713 577 1715
robert.kramp@cbre.com

 
Visit the Global Research Gateway
 
 
You may also unsubscribe by calling toll-free +1 877 CBRE 330 (+1 877 227 3330).

Please consider the environment before printing this email.

CBRE respects your privacy. A copy of our Privacy Policy is available online. For California Residents, our California Privacy Notice is available here. If you have questions or concerns about our compliance with this policy, please email PrivacyAdministrator@cbre.com or write to Attn: Marketing Department, Privacy Administrator, CBRE, 200 Park Ave. 19-22 Floors, New York, NY 10166.

Address: 2100 McKinney Avenue, Suite 700 Suite 700, Dallas TX 75201

© 2024 CBRE Statistics contained herein may represent a different data set than that used to generate National Vacancy and Availability Index statistics published by CBRE Corporate Communications or CBRE's research and econometric forecasting unit, CBRE Econometric Advisors. Information herein has been obtained from sources believed reliable. While we do not doubt its accuracy, we have not verified it and make no guarantee, warranty or representation about it. It is your responsibility to independently confirm its accuracy and completeness. Any projections, opinions, assumptions or estimates used are for example only and do not represent the current or future performance of the market. This information is designed exclusively for use by CBRE clients, and cannot be reproduced without prior written permission of CBRE.

CBRE and the CBRE logo are service marks of CBRE, Inc. and/or its affiliated or related companies in the United States and other countries. All other marks displayed on this document are the property of their respective owners.

Photos herein are the property of their respective owners. Use of these images without the express written consent of the owner is prohibited.