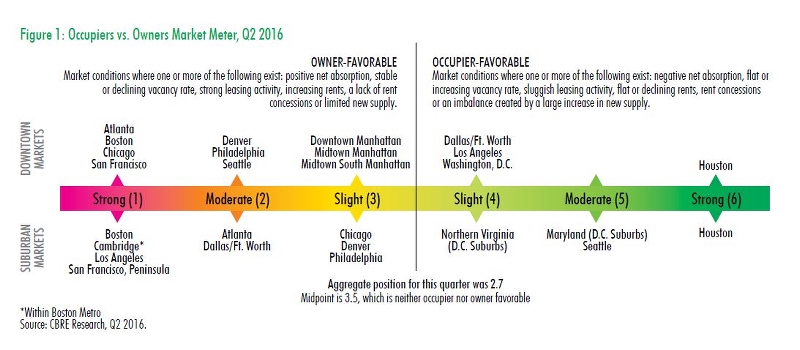
Who Does the Market Favor - Owners or Occupiers?
It is interesting to consider which U.S. markets are balanced and which tend to be more favorable toward occupiers or owners. The figure below indicates the larger metropolitan areas where ownership has a stronger negotiation position as compared to occupiers, and the cities where the reverse holds true. A value of 3.5 indicates a balance with no advantage for either group. This advantage is further delineated by downtown and suburban markets in these larger metropolitan areas. Note that Denver shows a moderate advantage in the downtown market with a slight advantage in the suburban market. The Salt Lake market is smaller, but tends to mirror Denver’s. Salt Lake favors ownership, but the downtown market is likely to have a slight advantage for ownership with the suburban market at a moderate advantage.
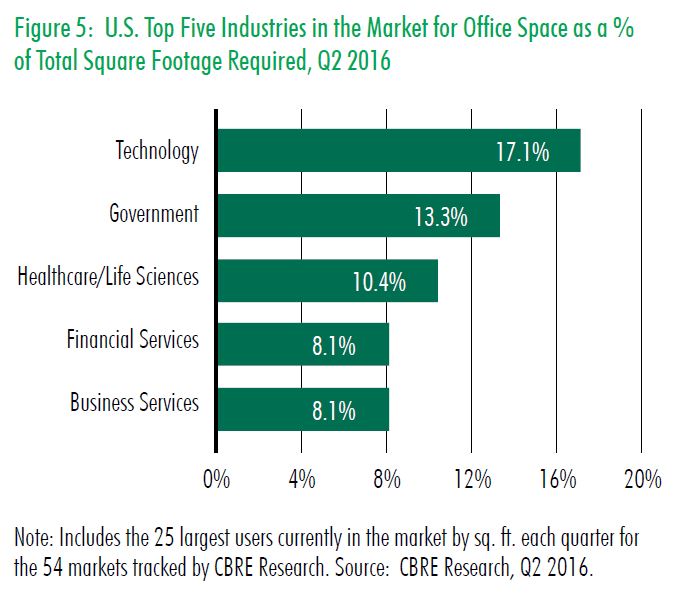
 What Industries Lead the Office Market?
Not surprising, technology has led the economy out of its long and deep recession and continues to spur market activity. The four other leading industries enhancing growth are government, healthcare/life sciences, financial services and business services. These same industries are fueling the Salt Lake economy, with technology being first and financial services second.
The bad news is that for the second consecutive quarter, the number of occupiers with active U.S. requirements has dropped, decreasing by 9% from Q1 2016 and 22% from Q4 2015. Salt Lake’s market activity remains steady, but with the increase in suburban office construction and additional subleased space available, the suburban market could likely begin to feel some slowing in net absorption as well as an increase in vacancy. If market slowing does occur, the increase in rental rates will also begin to taper off, thereby slowing rental growth.
What is the Forecast for Office Rental Growth?
CBRE Econometric Advisors have forecasted rent growth and increased vacancy for the U.S. office market until 2020.
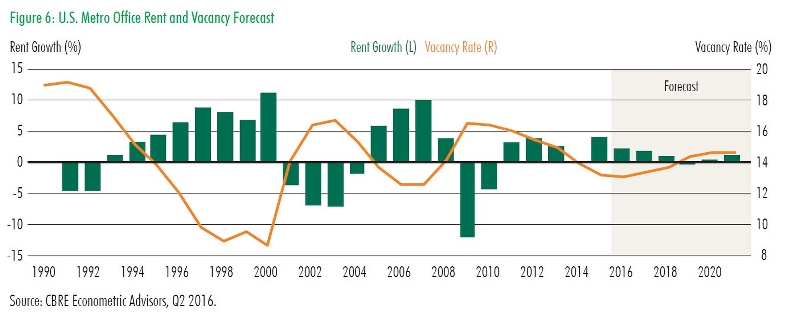
What is interesting and reassuring is that for the near term vacancy rates do not mirror those of the mid 90s and 2000s. Vacancy rates are projected to remain fairly stable with slight rental growth. Slow growth without any significant downward trends is much better news than another dark, long recession.
Vic and I look forward to responding to your market questions and providing advantage in achieving your real estate goals. We are here to serve you and exceed your expectations.