|
|
 |
|
 |
| Florida metros dominate U.S. capital markets in year-over-year growth |
|
 |
|
|
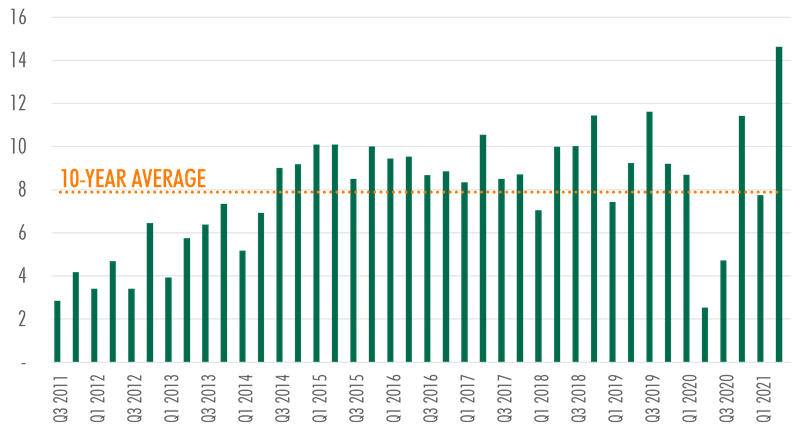
| The release of CBRE's Q2 2021 U.S. Capital Markets Figures report illustrated a trend that has been showing its face for the last three quarters: CRE capital markets in Florida are hot. Q2 2021 activity reached a new high in dramatic fashion, hitting $14.6 billion, significantly breaking the previous high of $11.6 billion set in Q3 2019.
Q2 2021 isn't an outlier. Over the last three quarters, activity has averaged $11.3 billion, 43% higher than the 10-year average. | |
|
|
|
| Figure 1: Quarterly CRE Investment Volume for Florida, in Billions of $ |
 |
Note: Volume includes office, industrial, multifamily, retail, and hotel assets.
Source: CBRE Research, Real Capital Analytics, Q2 2021. |
| |
|
|
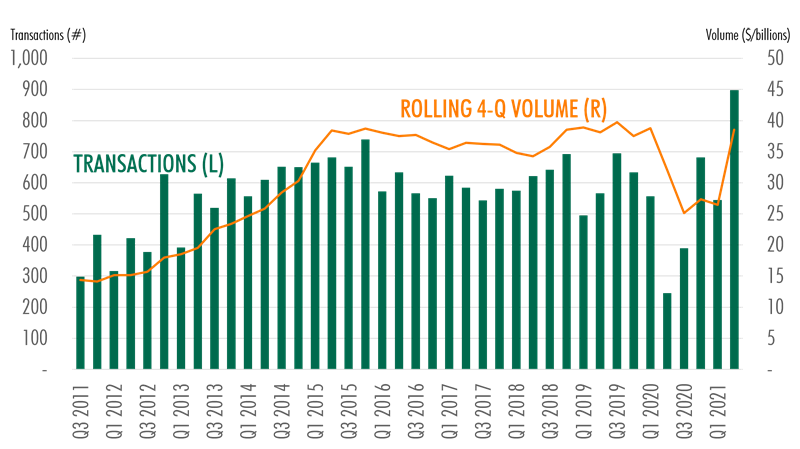
| Reaching almost 900, Florida hit an all-time high in total transactions in
Q2 2021, surpassing the previous high of 739 set in Q4 2015.
Rolling four-quarter transaction volume is also up, although it remains diminished by muted activity in Q3 2020 due to recessionary conditions due to the pandemic. | |
|
|
|
| Figure 2: Quarterly Transactions and 4-Q Rolling Capital Markets Volume for Florida |
 |
Note: Volume includes office, industrial, multifamily, retail, and hotel assets.
Source: CBRE Research, Real Capital Analytics, Q2 2021. |
| |
|
|
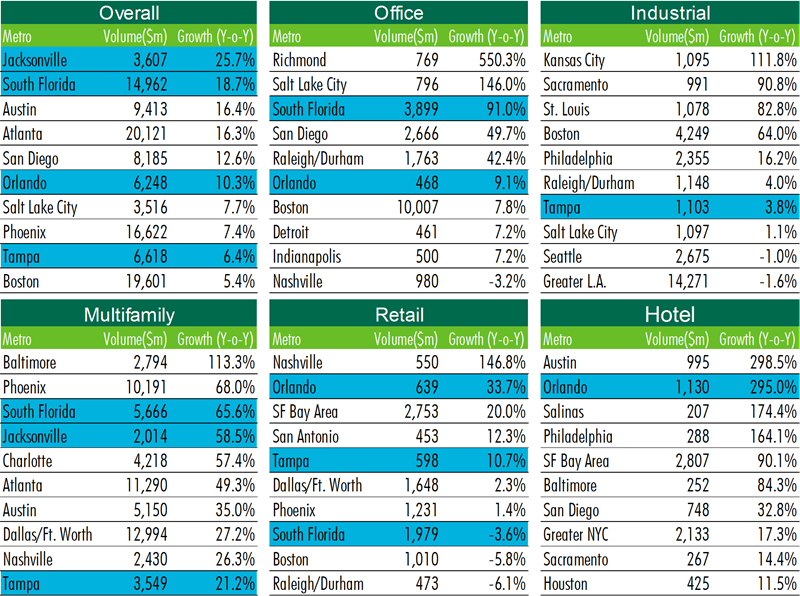
| When analyzing year-over-year investment volume growth by asset type and market, Florida's performance shifts from notable to staggering. All four major Florida markets found their way into the top ten nationwide, with Jacksonville leading the way at ~26% growth in investment volume. South Florida ranked second, over 200 basis points (bps) higher than 3rd and 4th place.
Highlights include South Florida achieving office volume 91% higher than the previous year, reaching 3rd place overall in the country, and by far the largest gain of the primary markets.
Multifamily saw significant gains occurred South Florida (66%) and Jacksonville (59%). Tampa was also present in the top ten, at 21% growth. Tampa also managed to land on the industrial asset top growth list.
Growth in capital markets volume for retail included two Florida markets in the top five, Orlando at 34% and Tampa at 11%. Orlando also ranked 2nd within hotels, at a staggering 295% growth, achieving $1.1 billion in volume. | |
|
|
|
| Figure 3: Investment Volume Growth by Market and Property Type, Year Ending Q2 2021 |
 |
Note: Tables are ranked by the highest percentage growth relative to prior trailing four-quarter period among top 30 metros or regions by volume.
Source: CBRE Research, Real Capital Analytics, Q2 2021. |
| |
|
|
| Population growth, low taxes, and a business-friendly climate that continues to encourage business expansion and attract new-to-market occupiers is propelling investor interest in Florida. After a brief lull, it is clear that commercial real estate investment has rebounded and Florida is among the nation’s most desirable markets. | |
|
|
|
|
|
|
|
 |
Unsubscribe
You may also unsubscribe by calling toll-free +1 877 CBRE 330 (+1 877 227 3330). Please consider the environment before printing this email. CBRE respects your privacy. A copy of our Privacy Policy is available online. For California Residents, our California Privacy Notice is available here. If you have questions or concerns about our compliance with this policy, please email PrivacyAdministrator@cbre.com or write to Attn: Marketing Department, Privacy Administrator, CBRE, 200 Park Ave. 19-22 Floors, New York, NY 10166. Address: 950 Main Avenue, Suite 200 Suite 700, Cleveland OH 44114 © 2026 CBRE Statistics contained herein may represent a different data set than that used to generate National Vacancy and Availability Index statistics published by CBRE Corporate Communications or CBRE's research and econometric forecasting unit, CBRE Econometric Advisors. Information herein has been obtained from sources believed reliable. While we do not doubt its accuracy, we have not verified it and make no guarantee, warranty or representation about it. It is your responsibility to independently confirm its accuracy and completeness. Any projections, opinions, assumptions or estimates used are for example only and do not represent the current or future performance of the market. This information is designed exclusively for use by CBRE clients, and cannot be reproduced without prior written permission of CBRE. CBRE and the CBRE logo are service marks of CBRE, Inc. All other marks displayed on this document are the property of their respective owners, and the use of such logos does not imply any affiliation with or endorsement of CBRE. Photos herein are the property of their respective owners. Use of these images without the express written consent of the owner is prohibited. Licensed Real Estate Broker
|
All of CBRE's COVID-19 related materials have been developed with information from the World Health Organization, the Centers for Disease Control & Prevention (and similar global organizations), public health experts, industrial hygienists, and global subject matter experts across CBRE and our strategic suppliers. Our materials may not be suitable for application to all facilities or situations.
Ultimately, occupiers and landlords must make and implement their own reopening decisions for their individual stakeholders and facilities. CBRE's guidance is intended to help facilitate those discussions and expedite the implementation of those decisions once made by the client. We make no representations or warranties regarding the accuracy or completeness of these materials. CBRE cannot ensure safety and disclaims all liability arising from use of these materials.
|
|
|
|


