On 29 June 2018, Statistics NZ released data showing that new home consents in Auckland had reached a 15-year high. One of the drivers of this was an increasing volume of apartment consents. This trend is reinforced by CBRE’s supply time series data, which shows short term growth in projected apartment supply based on expected completion dates. However, recent data on (lack of) project launches shows that apartment consent figures have limited scope to grow in the near future.
Apartment market growth
Rolling annual building consents in Auckland have exceeded 12,000 in the year to May 2018. Standalone housing comprises 47% of the total, with apartments and terraced housing at 24% and 21% respectively. Retirement units make up the remaining 8%.
Over the past two years, the volume of building consents has increased rapidly for some sectors and been stable for others. The rolling annual volume of standalone house consents in May 2016 was similar to the May 2018 result, however for apartments the figure almost doubled over this period. Terraced housing increased by around two thirds, and retirement units by one third. During the past two years, apartments have overtaken terraced houses as the second largest consented typology after standalone houses.
Chart 1: Auckland annual apartment supply - historic and forecast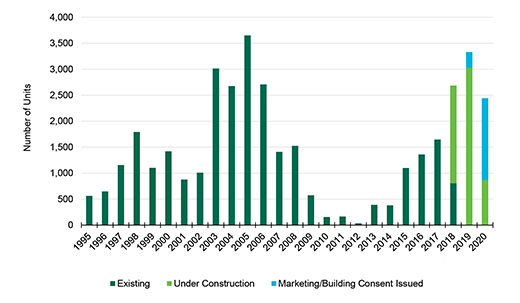 Source: CBRE
The Auckland apartment market supply over the past few years has been increasing, as seen in Chart 1. Last year, 1,650 units completed construction across the Auckland region. Supply projections show that the cyclical peak is yet to come, with 2,700 units expected to complete by the end of 2018 and more than 3,300 due to complete next year. With 94% of supply due over the next 18 months currently under construction, it is little wonder that recent growth in the volume of building consents for apartments has boosted the overall level of residential consents.
A shrinking pipeline
However, the future pipeline is shrinking. Despite strong growth in the level of building consents to date, it appears that changes in the development market environment mean that continued growth is not sustainable. Recent data on project launches shown in Chart 2 indicate that launches have significantly slowed over the past 12 months, with no CBD and Fringe launches occurring since September 2017. The CBD market has been particularly quiet, with just two projects launched to market during the past 18 months.
Chart 2: Number of saleable apartment units launched to market each month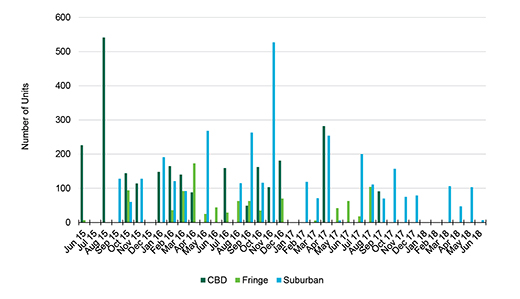 Source: CBRE
Slower launches are occurring at a time when the rate of project completions is increasing, and the impact of this can be clearly seen in Chart 3. The size of the current pre-construction pipeline is less than 2,000 units, the smallest it has been since 2014. With more than 3,300 units due for completion in 2019, there is serious potential for the pipeline to shrink further unless there is a material increase in new project launches. In this regard one of the more important swing factors will be the impact of Government actions around investment and rental market regulation, the effectiveness of the Kiwibuild programme and various efforts by Local and Central Government urban development agencies.
Chart 3: Size of the pre-construction apartment pipeline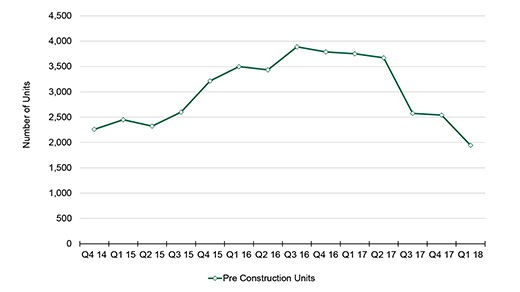 Source: CBRE

Zoltan Moricz, Senior Director, CBRE Research New Zealand
T +64 9 359 5399 | E
zoltan.moricz@cbre.co.nz
Tamba Carleton, Senior Research Analyst, CBRE Research New Zealand
T +64 9 359 5414 | E
tamba.carleton@cbre.co.nz