|
|
|
 |
Executive Summary
- Ongoing reductions in federal office space by the General Services Administration (GSA) are expected to have minimal impact on the national office market. The GSA leases about 1.7% of total U.S. office inventory across more than 1,800 cities. For every 10% reduction in GSA-leased space, the overall office vacancy rate would increase by 20 basis points (bps).
- For the first time in 18 quarters, the U.S. office vacancy rate fell in Q4 2024 due to improved demand and reduced new supply. While this potential stabilization sets the stage for an office market recovery, the reduction in GSA-occupied space could pose a moderate headwind. Much will depend on how quickly and effectively the agency can shrink its portfolio, as well as navigate lease termination rights and the complexity of selling owned and occupied buildings.
- The impact will be most pronounced in Washington, D.C., Suburban Maryland and Northern Virginia, which have the highest concentrations of GSA-leased space.
- Already weak demand for Class B/C buildings will be exacerbated by the GSA space reduction, further bifurcating a polarized U.S. office market.
- Based on data compiled on March 26, 2025, if all publicly listed GSA leases marked as “terminated” and that have an ongoing termination right were vacated, the overall U.S. office vacancy rate would increase by 10 bps.
The 12-year effort to reduce the federal real estate footprint is accelerating due to budget cuts and Department of Government Efficiency (DOGE) initiatives. Concurrently, the Trump administration has mandated a full return to office for all federal employees, adding complexity and uncertainty regarding space elimination. The GSA1 is reviewing options to optimize its real estate footprint and building utilization, including eliminating underutilized leased space and selling its outdated owner-occupied office buildings.
The GSA recently announced plans to cut its leased and owned portfolio by 50% after reducing its leased space by only 13% between 2013 and 2024.2 The Trump administration wants to quickly sell unused federally owned buildings and move government agencies to more efficiently managed leased space. Despite this dramatic shift, the impact on the U.S. office market is expected to be minimal due to the GSA’s small share of total U.S. office inventory, its widely dispersed leased space and the potential difficulty in selling federally owned buildings across major markets.3
Measuring the Impact
The overall U.S. office vacancy rate stabilized near a 30-year-high 18.9% at the end of 2024 after rising for 18 consecutive quarters. However, the termination of government leases announced over the past few months has raised concerns about the durability of the fledgling national office market recovery.
GSA-leased space across the 58 markets4 tracked by CBRE totals 69 million sq. ft. or 1.7% of total U.S. office inventory. We estimate that the U.S. vacancy rate would increase by approximately 20 bps for every 10% reduction in GSA-leased office space.
Thus far, the Trump administration has announced the termination of 679 leases totaling 7.8 million sq. ft. across all property types nationwide. More than 75% of these leases are for less than 10,000 sq. ft. and just 4% are for more than 50,000 sq. ft., limiting the negative impact. Nearly 65% of the GSA leases announced for termination are “soft term,” meaning they have an ongoing termination right that can be exercised without penalty. If all this soft-term space were terminated, CBRE estimates it would increase the U.S. office vacancy rate by only 10 bps.5
Market Exposure Varies
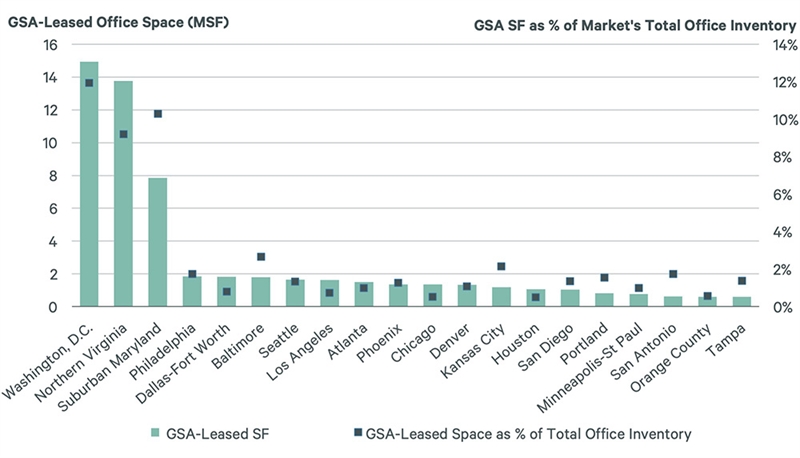
Markets with relatively high concentrations of GSA-leased space will be more adversely impacted by federal space cuts. Washington, D.C. (district only) has the largest concentration of GSA-leased office space totaling nearly 15 million sq. ft. or almost 12% of its total office inventory. Suburban Maryland (10.3%) and Northern Virginia (9.2%) have the next highest concentrations of GSA-leased space. The GSA is a less consequential tenant in other large markets, accounting for just 2.7% of leased office space in Baltimore, 2.1% in Kansas City and 1.7% in Philadelphia—each for less than 2 million sq. ft. |
|
|
Figure 1: Top 20 Office Markets for GSA-Leased Space
|
 |
|
Source: CBRE Research, U.S. General Services Administration, Q4 2024.
|
|
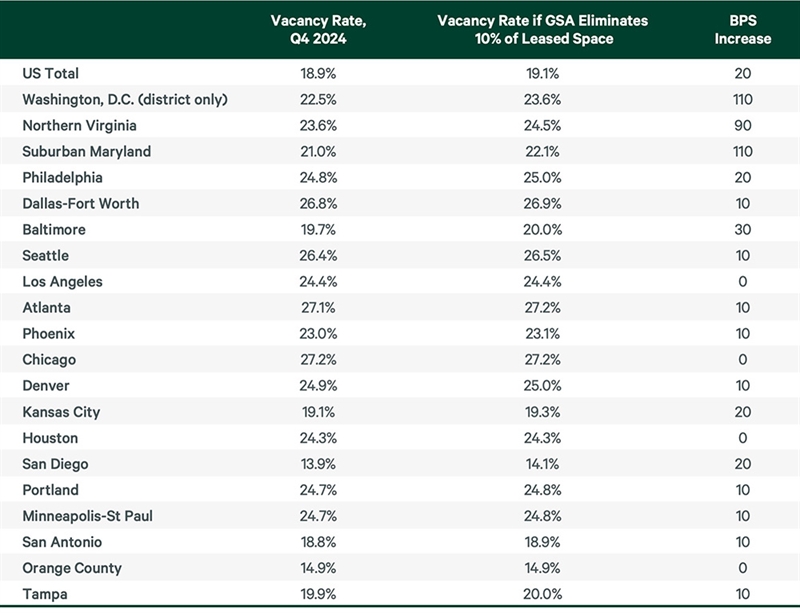
If 10% of the GSA-leased office footprint were eliminated in Washington, D.C., the office vacancy rate would increase by 110 bps to 23.6%, whereas a 10% reduction in Dallas would increase the vacancy rate by only 10 bps to 26.9%. |
|
|
Figure 2: Impact of a 10% Reduction in GSA-Leased Office Space on Vacancy by Market (ranked by total GSA-leased space)
|
 |
|
Source: CBRE Research, U.S. General Services Administration, Q4 2024.
|
|
In large markets where leasing activity has recently rebounded and the GSA footprint is relatively small (Atlanta, Boston, Los Angeles and Manhattan6), the impact of GSA portfolio reductions will likely be minimal. However, in markets such as Washington, D.C., Dallas and Philadelphia where the pipeline of tenants searching for space as of Q4 2024 is well below pre-pandemic levels and the GSA footprint is bigger than in other markets, the near-term impact may be greater. Nevertheless, any relocation of government agencies from federally owned space, which CBRE does not track, to available leased space could help reduce vacancy rates in many markets.
We expect continued bifurcation across U.S. office markets, where amenity-laden newer or recently renovated buildings in the best locations are most in demand and commodity space struggles to attract and retain tenants. As government-leased space is terminated and becomes available, we expect shadow space in quality buildings and connected locations to lease more quickly than space that is vacated in outdated buildings in fringe locations. This will exacerbate the glut of Class B/C space and put further downward pressure on rents.
How GSA Building Dispositions Factor In
In addition to leased space, the GSA has announced plans to dispose of its non-core owned assets. These owned buildings are not tracked by CBRE and are described by the GSA as “functionally obsolete and unsuitable for federal use” due to lack of congressional funding. The GSA does not have authority to sell buildings until it removes all existing tenants (largely government agencies).
Since GSA disposition data is ever changing, how these owned buildings will affect the office market once sold remains unclear. However, it is unlikely that these buildings will be reused as office space without significant improvements. Additionally, the sale of some of these properties could lead to retrofit, demolition or adaptive reuse projects, which could have positive impacts within certain submarkets, especially where there are clusters of these buildings.
The relocation of government agencies from federally owned to privately owned buildings may benefit certain markets by increasing demand for space, while the owned buildings, which CBRE does not track, will likely be demolished or converted to another use. |
|
|
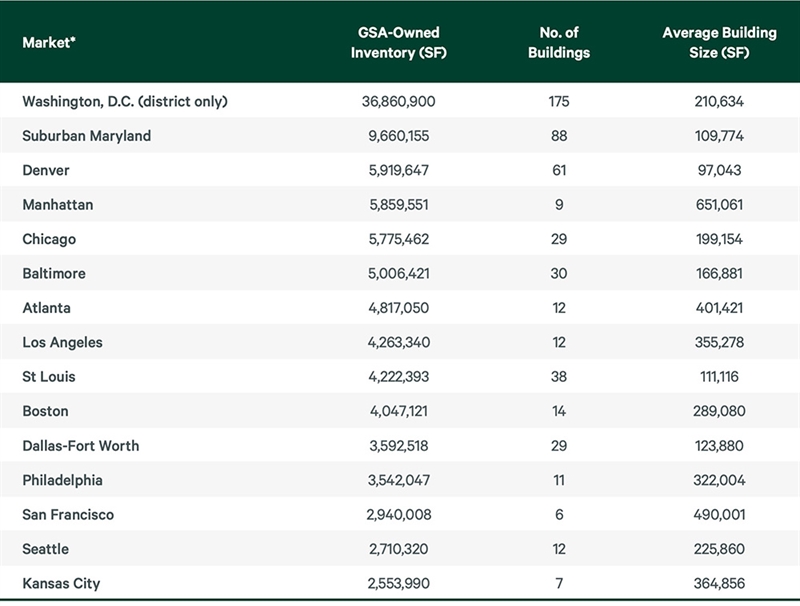
Figure 3: Top Markets for GSA-Owned Real Estate (all property types)
|
 |
|
* The GSA owns only about 1.8 million sq. ft. in Northern Virginia but leases approximately 13.7 million sq. ft.
Source: CBRE Research, U.S. General Services Administration, Q4 2024.
|
|
1 The GSA is one of the largest owners and leasers of federal office buildings.
2 “Federal buildings chief eyes 50% space reduction, moving GSA out of its headquarters,” Federal News Network, January 28, 2025.
3 Based on public information from GSA Lease Inventory Download as of December 2024. This includes all leases signed by the GSA and excludes those signed by other easing authorities. The data on terminated leases came from a DOGE savings website as of March 26, 2025.
4 CBRE office stats track buildings of 10,000 sq. ft. or more in 58 markets but do not include owner-occupied buildings.
5 Of the 7.8 MSF of GSA lease terminations announced by DOGE, 2.7 MSF is within CBRE tracked space, and of that, 2.2 MSF has a soft term.
6 CBRE Research Office Figures, Pulse of U.S. Office Demand, Q4 2024.
|
|
|
|
|
Unsubscribe
You may also unsubscribe by calling toll-free +1 877 CBRE 330 (+1 877 227 3330). Please consider the environment before printing this email. CBRE respects your privacy. A copy of our Privacy Policy is available online. For California Residents, our California Privacy Notice is available here. If you have questions or concerns about our compliance with this policy, please email PrivacyAdministrator@cbre.com or write to Attn: Marketing Department, Privacy Administrator, CBRE, 200 Park Ave. 19-22 Floors, New York, NY 10166. Address: 2100 McKinney Ave Suite 700, Dallas TX 75201 © Copyright 2026. All rights reserved. This report has been prepared in good faith, based on CBRE's current anecdotal and evidence based views of the commercial real estate market. Although CBRE believes its views reflect market conditions on the date of this presentation, they are subject to significant uncertainties and contingencies, many of which are beyond CBRE's control. In addition, many of CBRE's views are opinion and/or projections based on CBRE's subjective analyses of current market circumstances. Other firms may have different opinions, projections and analyses, and actual market conditions in the future may cause CBRE's current views to later be incorrect. CBRE has no obligation to update its views herein if its opinions, projections, analyses or market circumstances later change. Nothing in this report should be construed as an indicator of the future performance of CBRE's securities or of the performance of any other company's securities. You should not purchase or sell securities-of CBRE or any other company-based on the views herein. CBRE disclaims all liability for securities purchased or sold based on information herein, and by viewing this report, you waive all claims against CBRE as well as against CBRE's affiliates, officers, directors, employees, agents, advisers and representatives arising out of the accuracy, completeness, adequacy or your use of the information herein. CBRE and the CBRE logo are service marks of CBRE, Inc. All other marks displayed on this document are the property of their respective owners, and the use of such logos does not imply any affiliation with or endorsement of CBRE. Photos herein are the property of their respective owners. Use of these images without the express written consent of the owner is prohibited.
|
|
|