|
|
Francis | Ybarra | Moothart | Birrell | Santangelo | Korinek | Britt | Coleman |
Grabher | Thorp | Post | Walker |
|
State of the Commercial Real Estate Debt Market
|
|
- The number of active lenders in the market increased significantly since the 1Q 2024, indicating a growing appetite for commercial real estate lending across all property sectors. Even the CBD office market that has struggled since the pandemic experienced improved debt liquidity in the 4Q 2024, with a 27% increase in the number of unique lenders originating loans for CBD office buildings compared to a year earlier
- Investment volumes in the commercial real estate market continue to increase in 2025 following seven quarters of decline that ended in the 4Q 2024, solidifying a turning point in the market.
- All-in financing costs, including interest rates and fees, decreased throughout 2024 and into Q1 2025 as central banks continued to cut rates, making it easier for borrowers to secure financing. Additionally, the reopening of the CMBS market and the decrease in back leverage pricing have made debt more attractive.
- Asset prices in the commercial real estate market have stabilized, and some assets, such as retail, logistics, and even select prime office properties, have started to see marginal increases in value.
- Lenders' risk appetite has increased, with leverage levels for senior debt at 60%–65% for all asset types, likely reaching a ceiling given the return to pre-COVID levels. The only outlier remains office, which can achieve 55%–60% LTV and up to 70% for well-located Class A trophy assets with credit tenants, strong WALT, and limited term rollover.
- The volatile Treasury market post-election has made rate-locking a critical factor for borrowers of long-term fixed-rate loans. If the volatility continues, we expect spreads to widen. Volatility in Treasury yields often signals uncertainty in the broader economic environment, prompting investors to seek stability in other asset classes. When Treasury yields fluctuate significantly, the relative risk of holding Treasury bonds increases, making other investments, such as corporate bonds or high-yield bonds, appear more attractive by comparison.
- Many new funds raised throughout the year began acquiring assets in the fourth quarter and plan to continue in the first half of the year. There is pent-up demand from 2024, plenty of dry powder to be deployed, and the debt funding gap has continued to narrow.
- Lenders increased activity seeking to replace maturing facilities and compete on deals that align with their financing appetite to expand their loan books. They have greater scope to include asset classes such as well-secured office, hotel, and retail investments. Competition for the right deals has put downward pressure on margins across the board.
- Regional banks have increased lending to maintain their portfolios as loans are maturing, with some relaxing depository requirements. Money Center Banks that have been focused on CMBS and corporate credit are back to project financing, including data center construction, retail/grocery acquisitions, and even select office financing. Agency lending fell short of their 2024 volume targets but still offer the best multifamily product in the market and we’ve seen an increase in agency loan requests so far in 2025.
|
|
Current Index Rates and Trends
|
|
The below matrix compares key index rates over the last 12 months as of 4/7/2025. The mid- and long-term US Treasury yield curve remains elevated, driven by multiple factors like fiscal policy, trade policy, and global growth. We expect to see continued volatility in rates as events continue to unfold. |
|
INDEX
|
AS OF 4/7/25
|
AS OF 1/8/25
|
AS OF 4/8/24
|
12-MO. CHANGE
|
|---|
|
10-YR US Treasury
|
4.18%
|
4.71%
|
4.43%
|
-0.25%
| |
7-YR US Treasury
|
4.01%
|
4.58%
|
4.43%
|
-0.42%
| |
5-YR US Treasury
|
3.87%
|
4.47%
|
4.44%
|
-0.57%
| |
3-YR US Treasury
|
3.78%
|
4.36%
|
4.61%
|
-0.83%
| |
6-MO US Treasury
|
4.16%
|
4.28%
|
5.33%
|
-1.17%
| |
*SOFR-NY FED-30-DAY TERM
|
4.33%
|
4.29%
|
5.31%
|
-0.98%
|
|
|
|
|
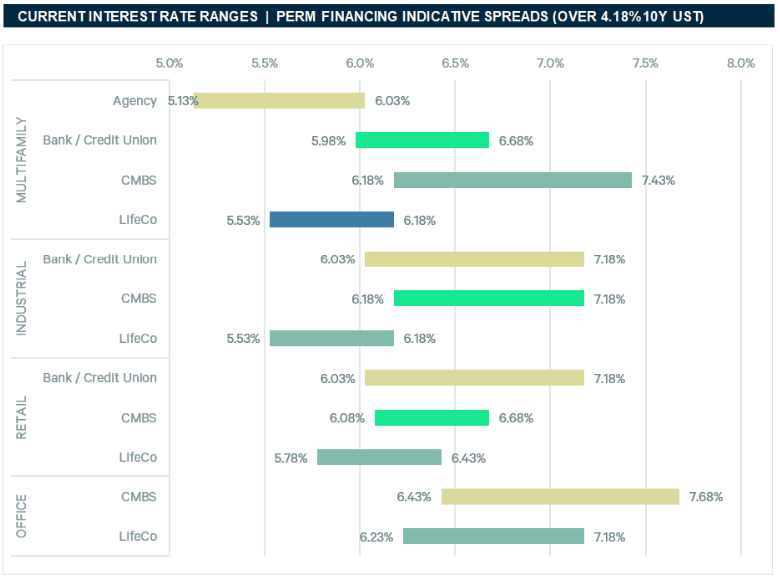
The below matrix compares fixed rate permanent financing pricing by property and lender type as of 4/7/2025, based on an assumed 10-year UST index rate of 4.18%. Please reach out to a producer for specific deal terms.
|
|
Source: CBRE Debt & Structured Finance recently quoted deals (Agency pricing represents conventional-sized deals at $7.5M+ before buydowns which are in the range of 25 bps+/-.).
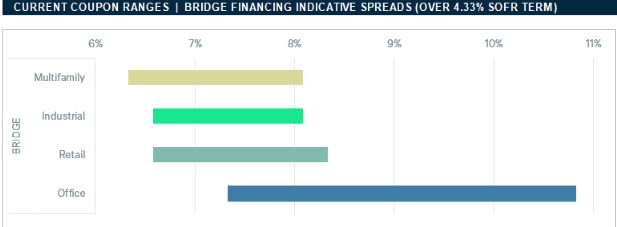
The below matrix compares floating rate bridge financing pricing by property type as of 4/7/2025, based on an assumed 30-Day Term SOFR index rate of 4.33%. Please reach out to a producer for specific deal terms.
|
Source: CBRE Debt & Structured Finance recently quoted deals |
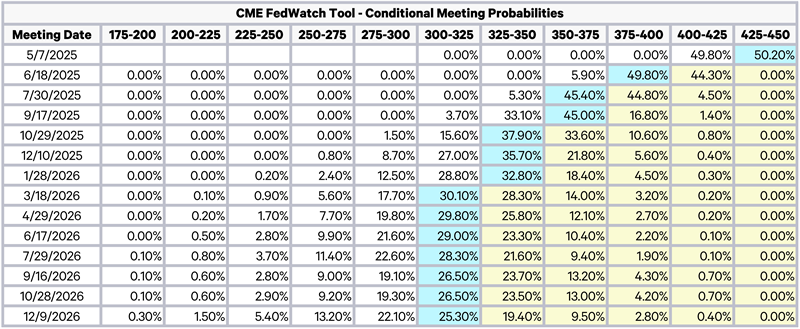
| FEDERAL FUNDS RATE CUT PROBABILITY |
The below chart tracks the probabilities of changes to the Fed target rate and U.S. monetary policy according to interest rate traders, as implied by 30-Day Fed Funds futures pricing data.
|
|
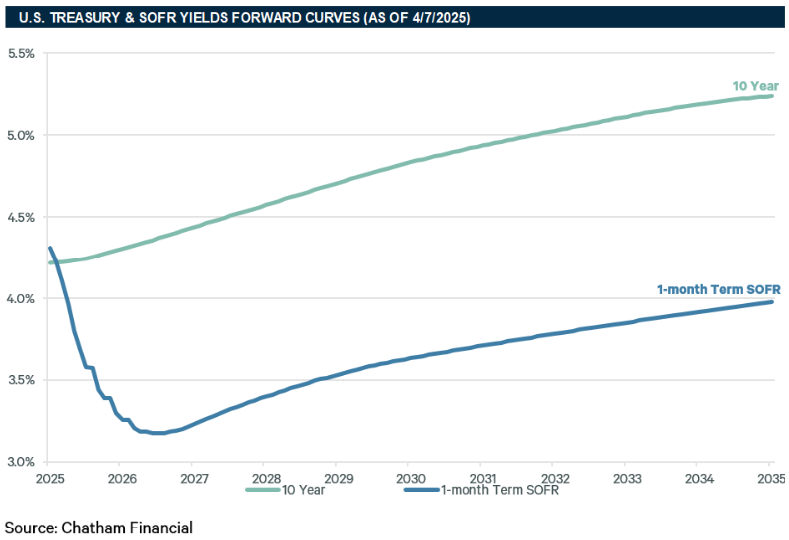
The below chart shows current SOFR and 10-Year Treasury Index forward curves which can be useful for forecasting, but should not be viewed as predictive of actual future interest rates. UST forward curves represent future yields based on observable market data (futures contracts, market swap rates, and current outstanding Treasury Instruments), while the SOFR forward curve represents market-implied future setting for 1-Month Term SOFR.
|
Commercial Property Lending Rises Annually, Led by Life Insurers
U.S. commercial property lending increased last year, primarily driven by a surge in loans from insurance companies. The Mortgage Bankers Association (MBA) reported a 3.7% rise in commercial and multifamily mortgage debt outstanding at the end of 2024 compared to the previous year. Life insurance companies led this growth, accounting for nearly 39% of the annual increase in commercial debt, while bank holdings grew by just 1%. Insurance companies have historically been cautious underwriters, with their commercial mortgages typically having lower loan-to-value ratios and backing properties with high net income streams. This conservative approach has kept their mortgage performance relatively stable. The MBA also noted that multifamily mortgage debt grew by 1.8% in the fourth quarter, continuing to outpace the overall nonresidential commercial market. Despite challenges such as low occupancy rates and the uncertain impact of return-to-office mandates, delinquency rates remain relatively low. Banks reported a slight increase in loan delinquencies, while life insurers saw a decrease. The article underscores the resilience of the commercial property lending market amidst evolving economic conditions.
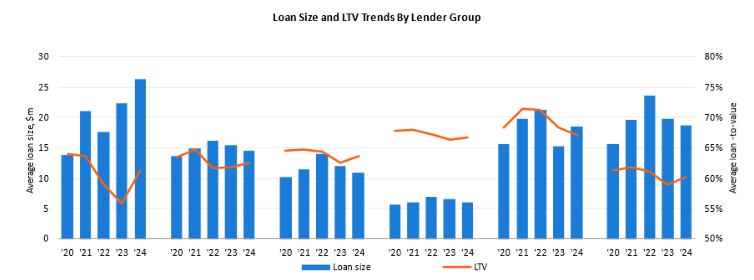
Lender Composition 2024
In 2024, CMBS (Commercial Mortgage-Backed Securities) and investor-driven lenders made a strong comeback in the debt market, highlighting the growing strength of non-bank lenders. Banks, on the other hand, lost significant market share, and government agencies slightly reduced their lending activities, indicating a shift away from traditional lenders.
CMBS originations surged, capturing a 22% share of the market due to a 143% year-over-year increase in loan volume. Investor-driven sources, such as debt funds, also saw a 47% rise in loan volume compared to 2023. CMBS led in large loans (over $50 million), accounting for 46% of such originations, with the average loan size increasing to $26.2 million. Securitized lending had one of the lowest average loan-to-value ratios (LTVs) at 61.3%, second only to insurance lenders, who prioritize safer loans. CMBS lenders targeted higher-quality properties, as evidenced by the decline in average cap rates on newly originated loans to 6.9% in 2024 from 7.2% in 2023.
Banks' overall market share fell to 28% in 2024 from 40% the previous year. Regional and local banks' share dropped to 17% from 26%, while national banks' share declined to 8%, a decade low. Despite this, regional and local banks continued to dominate smaller loans, providing more than half of loans under $10 million. Government agencies also saw a reduced share of originations, down to 24%, which is still slightly above their average in the five years before the pandemic.
On Again, Off Again: Tariffs & Commercial Real Estate
President Trump has imposed tariffs of up to 25% on certain goods from America’s top two trading partners—Mexico and Canada—and an additional 10% tariff on goods from China, the country’s third-largest trading partner. Additional tariffs are also being considered. Exceptions were granted until April 2 for imports from Canada and Mexico covered under the USMCA.
Economists generally agree that these tariffs, which have already caused sharp volatility in both bond and equity markets, will slow short-term economic growth and increase inflation. In the long term, tariffs may encourage some companies to boost domestic manufacturing activity.
Industrial and retail property fundamentals will experience the most immediate impacts from tariffs if consumer spending power is reduced and the flow of goods shifts. The office market recovery should continue, barring an economic downturn. It is expected that some large industrial occupiers may delay signing leases in the near term, with third-party logistics (3PL) companies accounting for a larger share of leasing activity as more businesses rely on them amid uncertainty.
Privatization of Fannie Mae and Freddie Mac Could Increase Costs and Tighten Credit for Multifamily Loans:
The privatization of Fannie Mae and Freddie Mac could significantly impact commercial multifamily loans. Currently, these entities provide substantial liquidity to the multifamily lending market by purchasing loans from private lenders and packaging them into mortgage-backed securities. Privatization could reduce this liquidity, as a privatized Fannie Mae and Freddie Mac might face higher capital costs, which could be passed on to borrowers in the form of higher interest rates. Additionally, privatization might lead to tighter credit standards, as the focus could shift towards more profitable, less risky segments of the multifamily market, potentially leaving affordable housing developers and lower-credit borrowers with fewer options. Without government backing, the cost of capital for Fannie Mae and Freddie Mac could increase, leading to higher borrowing costs for multifamily loans. This could make financing more expensive for developers and investors, potentially hindering new projects and limiting the availability of affordable housing. On the positive side, privatization could foster increased competition in the multifamily lending market, diversifying the sources of capital available for multifamily financing and potentially introducing new products and innovations that improve market efficiency. However, the specific mandates of Fannie Mae and Freddie Mac to promote affordable housing, including multifamily housing, could be jeopardized, making it more challenging to finance affordable housing projects, especially in low-income areas. Overall, while privatization could lead to increased competition and market diversification, it also poses risks of reduced liquidity, tighter credit standards, and higher borrowing costs, which could negatively impact the availability and affordability of multifamily housing.
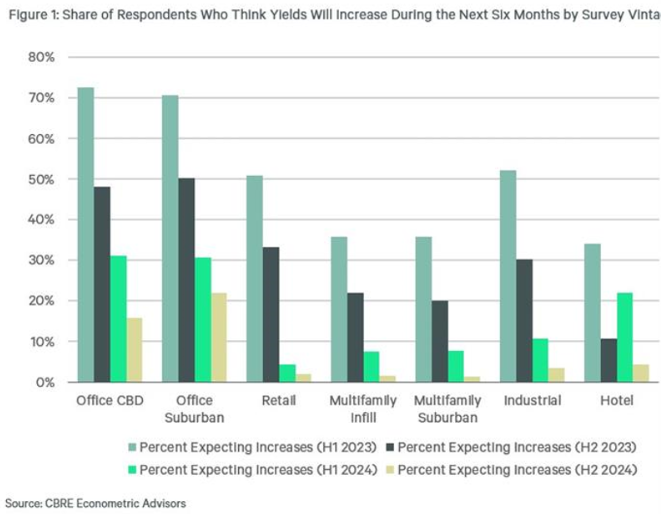
Capital Markets Pros Believe Cap Rates Have Peaked
The Below presents the results from the four most recent Cap Rate Surveys (CRS) for all property types. In the latest survey, conducted in November and December 2024, fewer respondents believe cap rates will increase compared to the previous three surveys. The most common response for all property types was "no change."
Although office properties still have the highest share of respondents expecting further valuation declines, this proportion has significantly decreased over the past two years. The outlook for offices is improving, especially for prime properties in major central cities. However, the outlook is less favorable for suburban office markets, where investors continue to demand a risk premium due to weak fundamentals and a lack of prime spaces. This bifurcated performance in the office market is expected to persist.
|
The commercial real estate debt market is currently navigating a complex environment influenced by several key factors. Elevated interest rates and high inflation have significantly impacted the market, leading to increased borrowing costs and higher debt service obligations for property owners resulting in a cautious approach from both investors and lenders seeking greater clarity on pricing and economic stability. Additionally, a substantial amount of CRE debt is set to mature in the coming years, with over $1 trillion in loans due in the next two years and an additional $2.56 trillion maturing over the next five years. This creates potential risks for banks, particularly regional and community banks, which have higher exposure to CRE loans. Distress levels in the CRE bond market have also reached record highs, with distress rates hitting 13.8% by late 2024, indicating significant challenges in refinancing and managing existing debt obligations. The CRE debt market is at a pivotal moment, facing both significant challenges and promising opportunities. As the market navigates these complexities, strategic planning and adaptive measures will be essential for stakeholders to thrive in the evolving landscape.
Our Team is actively seeking the most accretive financing solutions in the market across a broad range of lender and product types. We are consistently achieving the best possible outcomes for our Clients’ commercial real estate financing needs. Please call us to discuss your next financing requirement. |
|
 |
|
|
Unsubscribe
You may also unsubscribe by calling toll-free +1 877 CBRE 330 (+1 877 227 3330). Please consider the environment before printing this email. CBRE respects your privacy. A copy of our Privacy Policy is available online. For California Residents, our California Privacy Notice is available here. If you have questions or concerns about our compliance with this policy, please email PrivacyAdministrator@cbre.com or write to Attn: Marketing Department, Privacy Administrator, CBRE, 200 Park Ave. 19-22 Floors, New York, NY 10166. Address: 4301 La Jolla Village Drive Suite 3000 Suite 700, San Diego CA 92122
THIS IS A MARKETING COMMUNICATION © 2026 CBRE, Inc. All rights reserved. This information has been obtained from sources believed reliable but has not been verified for accuracy or completeness. CBRE, Inc. makes no guarantee, representation or warranty and accepts no responsibility or liability as to the accuracy, completeness, or reliability of the information contained herein. You should conduct a careful, independent investigation of the property and verify all information. Any reliance on this information is solely at your own risk. CBRE and the CBRE logo are service marks of CBRE, Inc. All other marks displayed on this document are the property of their respective owners, and the use of such logos does not imply any affiliation with or endorsement of CBRE. Photos herein are the property of their respective owners. Use of these images without the express written consent of the owner is prohibited.
|
|
|


.jpeg)