|
|
|
CBRE | National Office Partners | Bay Area
|
|
|
|
| SAN FRANCISCO OFFICE MARKET |
Surging San Francisco Tenant Demand
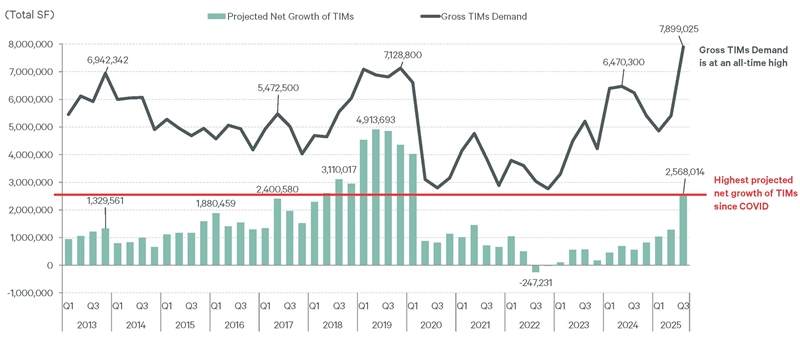
San Francisco confirmed its status as one of the nation's top-performing office markets in Q3, driven by a powerful wave of demand from the AI sector and other tech companies. This momentum was reflected by an astounding 112% annual increase in demand and a 60% quarterly climb, reaching an all-time high of 7.9 million square feet. This demand indicates that occupancy growth will accelerate and further reduce vacancy into 2026, leading to higher rents and fewer concessions.
Source: VTS
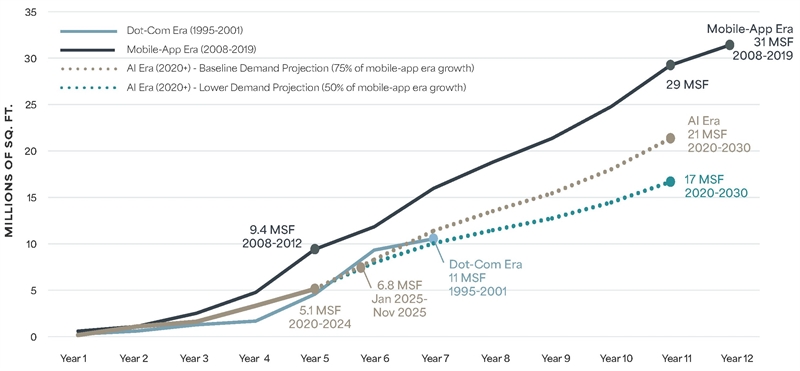
San Francisco Gross TIMS Demand vs. Projected Net Growth of TIMS
|
Source: CBRE Research
|
|
Artificial Intelligence: The Next Catalyst for Office Space Demand
San Francisco has experienced three significant tech-driven real estate booms in the past 30 years, with the current AI era being the latest. Each boom has seen a massive expansion of tech companies’ office footprints, leading to dramatic drops in vacancy rates.
 |
|
|
|
|
|
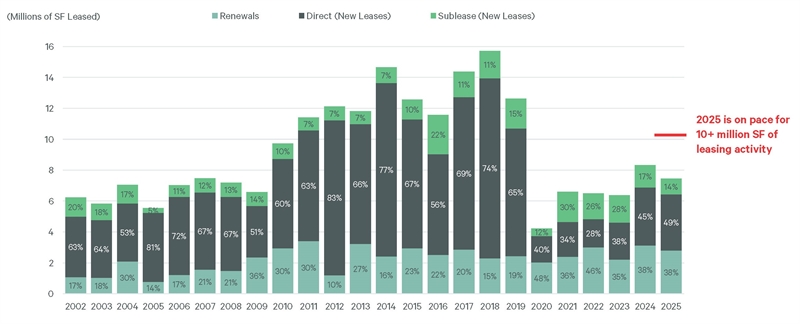
Leasing activity reached a near-record high in Q3 2025, totaling 1.8 million square feet for the quarter and 7.5 million square feet year-to-date, placing 2025 on track for the highest annual total since 2019. This surge in leasing was largely driven by emerging A.I. and tech firms like Anthropic and Brex, who focused their expansion deals on Class A buildings in the South Financial District and South of Market submarkets. Consequently, the market's rebound continued with a fourth consecutive quarter of occupancy gains, marked by 313,491 square feet of positive net absorption that pushed the vacancy rate down to 34.4%.
San Francisco Leasing Activity Nears Pre-Pandemic Levels
 Source: CBRE Research
Notable San Francisco Sale Activity Source: CBRE Research
Notable San Francisco Sale Activity
|
| There has been no shortage of capital chasing available product for San Francisco office buildings. Family offices and HNWI have been joined by institutional private equity and owner-users to create a highly competitive buy-pool. Investors are drawn to dramatic discounts to peak pricing, surging leasing demand, and a more business friendly City Hall. |
|
|
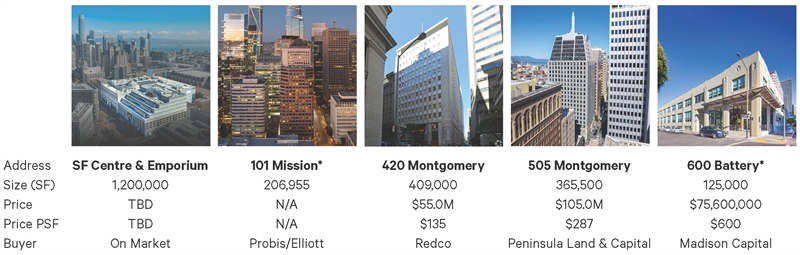 *Indicates Loan Sale
|
| SILICON VALLEY OFFICE AND R&D MARKETS |
AI is Fueling Demand in the Valley
Moving south, Silicon Valley office market is also being revived by an AI surge, driving tenant demand to its highest level in over three years, with more than half of new requirements originating from tech and AI firms. While San Francisco remains dominant in regional AI job postings (91% share), Santa Clara County's share is accelerating, jumping from 3.4% to 8.3% over the past three years due to companies like Databricks, OpenAI, Anthropic, and Scale AI.
Source: CBRE Research
Flight-to-Quality: Tech Giants Drive Down Office Vacancy
The Silicon Valley office market, encompassing 107.5 million square feet, showed continued stabilization and resilience in Q3 2025. The vacancy rate decreased for the fourth straight quarter, dropping 150 basis points to 16.6%, while the availability rate held stable at 18.7%. This improvement was driven by a robust net absorption of 684,380 square feet, with approximately half attributed to significant leasing activity in Sunnyvale, including a major deal by Databricks. Overall leasing activity remained strong at 2.2 million square feet, heavily skewed toward Class A properties (75.6%) and large transactions over 100,000 square feet.
R&D is Resilient: Big Trades and Small Deals Offset Vacancy Swings
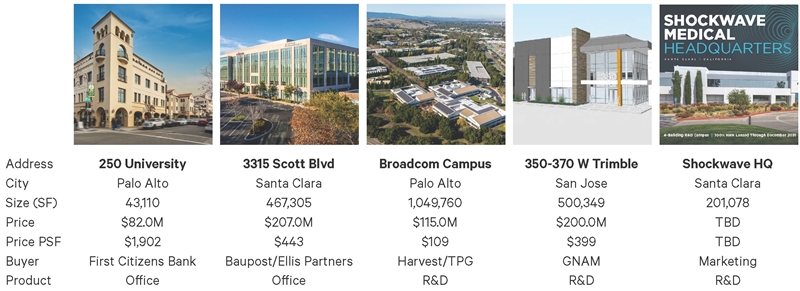
The Silicon Valley R&D market, totaling 141.2 million square feet, remained stable in Q3 2025, with vacancy holding steady at 11.9%. Leasing volume hit 1.7 million square feet, driven primarily by a high volume of small and medium-sized deals, with new leases representing over 71% of activity. The quarter saw strong investor confidence, highlighted by Harvest Properties/TPG's acquisition of the 1.1 million-square foot Broadcom Campus.
Notable Silicon Valley Office/R&D Sales - Q3 2025
 |
Tenant Optimism Fuels Surge in Oakland Office Demand
The renewal of tenant confidence is breathing life back into Oakland's office market. As economic conditions brighten, companies are increasingly willing to make long-term lease commitments, signaling a fundamental shift from caution to growth-oriented strategy. This returning demand should translate directly into positive net absorption and a surge of interest in key locations, firmly positioning the market for recovery.
| Current Demand |
2025 SF % Growth |
| 955,7000 SF / 57 Tenants |
36% |
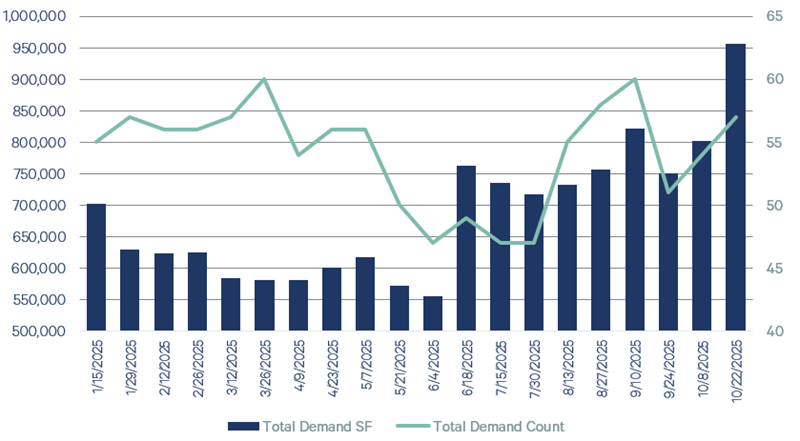
Source: CBRE Research
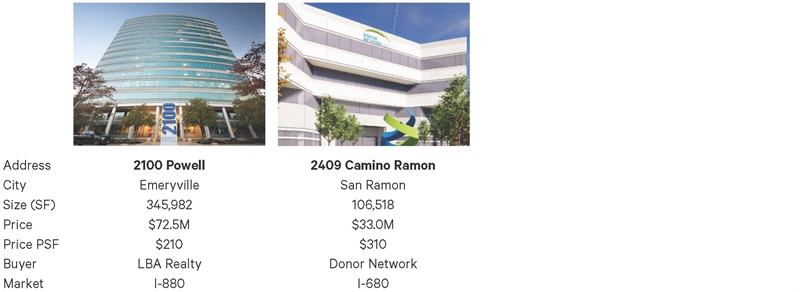
Resilience in Contra Costa County
The I-680 Corridor office market, a massive 34.3 million square feet, is demonstrating resilience despite persistent challenges. Although the vacancy rate continues to climb, optimism prevails. This upbeat outlook is bolstered by strong underlying fundamentals and the growing belief that the market is nearing a turning point. A crucial stabilizing factor is the reduction in office inventory, which has contracted by 3.4% year-over-year since Q3 2024.
Notable East Bay Office Sales - Q3 2025
 |
Leasing Activity Surges 76.2%, Signaling Peninsula Momentum
Despite the ongoing trend of negative absorption for office product in the Peninsula, the market is showing clear signs of resilience and momentum. This quarter saw a robust 76.2% increase in overall leasing activity and a 57.0% increase in active tenants—a significant uptick suggesting that, even amid structural challenges, tenants are actively pursuing opportunities, particularly in premium spaces, indicating strong long-term confidence in the market's viability.
Notable Peninsula Office Sales - Q3 2025
The Peninsula market recorded several major portfolio sales this quarter and notably, the first two listed below are planned for residential redevelopment.
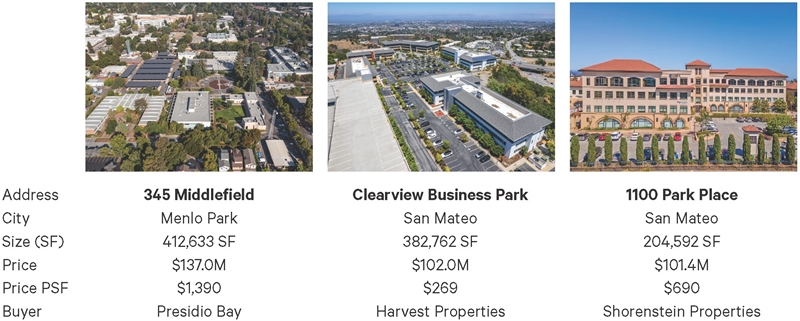 Photo Source: CBRE Research and Costar
|
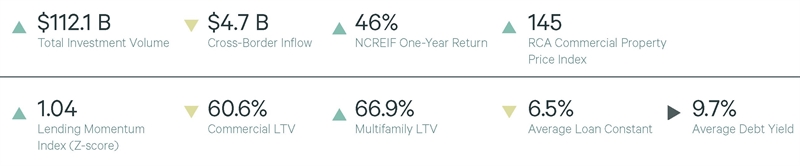
Investment Volume Increases, Lending Conditions Improve |
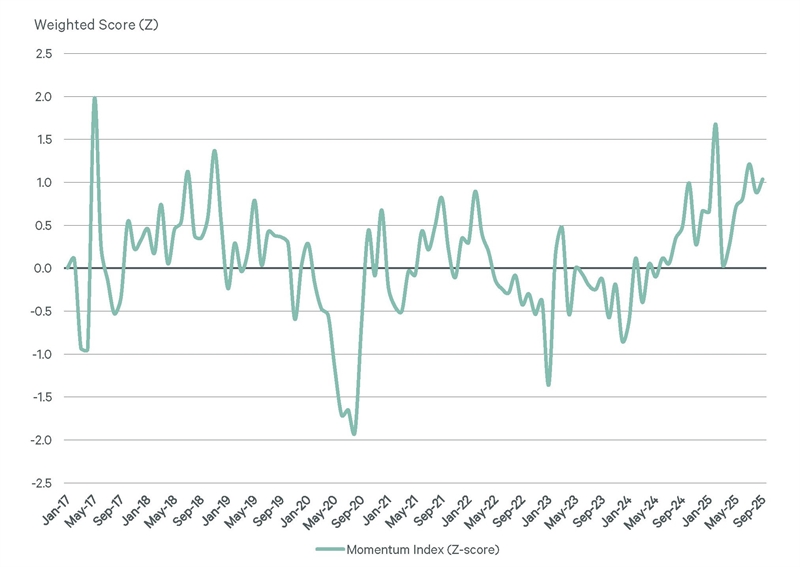
- In Q3 2025, the U.S. commercial real estate market showed renewed momentum, with a rise in lending activity and investment across most property types; this was reflected in the CBRE Lending Momentum Index's 0.55-point year-over-year increase to 1.04, driven by higher loan origination volumes and larger deal sizes.
- The office sector experienced a remarkable rebound, with investment volume jumping 35% year-over-year to $19 billion, particularly in key metros like the San Francisco Bay Area, which saw a 143% increase, signaling renewed confidence.
- The lending environment is poised to strengthen further following the Federal Reserve’s latest 25-basis-point rate cut on Oct 29, bringing the benchmark rate down to a range of 3.75%–4.00%, which is the second cut in as many months and is expected to reduce borrowing costs.
- This macroeconomic tailwind could accelerate the rebound, especially in high-growth metros such as San Francisco, New York, and Seattle, as underwriting standards ease and capital becomes more accessible, increasing lender interest, particularly in recovering sectors like office.
|
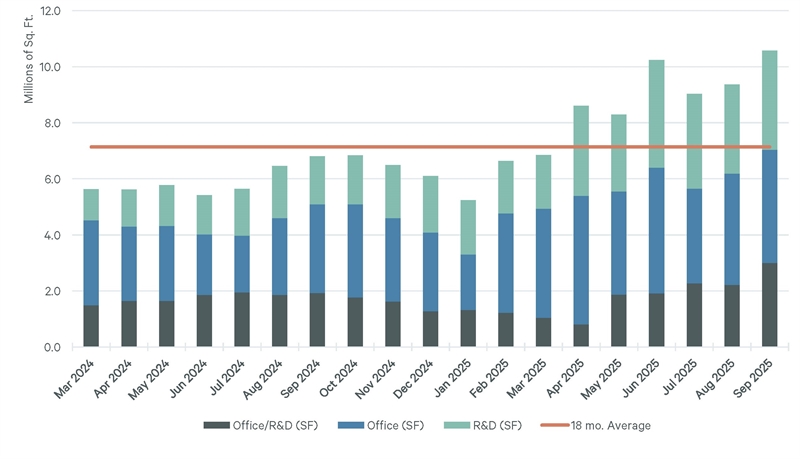
| Permanent Loan Financing Amounts Increased by 36% Year-Over-Year in Q3 |
|
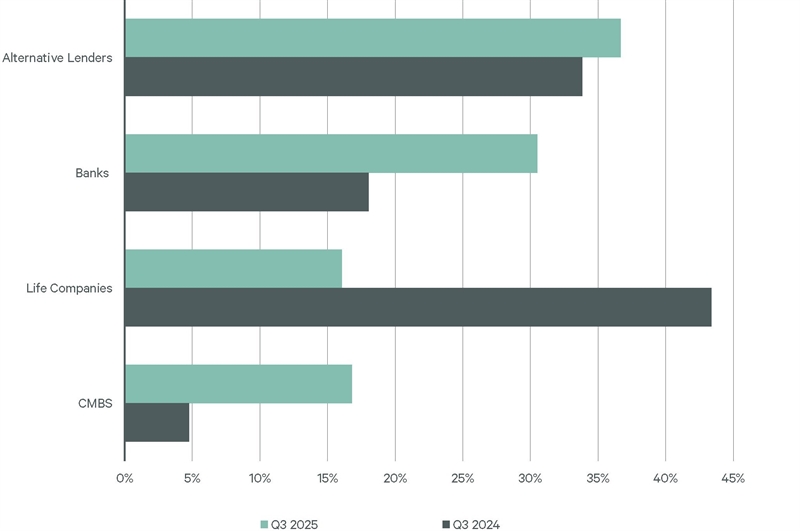
| Alternative Lenders & Banks Lead Q3 Loan Closings |
‒Alternative lenders accounted for 37% of loan closings by non-agency lenders in Q3, up from 34% a year ago. Debt funds drove the increase with a 68% year-over-year rise in lending volume.
‒Banks accounted for 31% of loan closings by non-agency lenders in Q3, up from 18% a year ago. Banks’ origination volume increased by 167% as they continued to reenter the market.
‒Life companies had a 16% share of non-agency loan volume in Q3, down from 43% a year ago.
‒CMBS lenders had a 17% share of closed non-agency loans in Q3, up from 5% a year ago. CMBS lending volume was five times more than a year ago, driven by active private-label CMBS issuance.
| Lender Composition for Non-Agency Commercial/Multifamily Loans |
Source: CBRE Research |
|
 |
|
|
Unsubscribe
You may also unsubscribe by calling toll-free +1 877 CBRE 330 (+1 877 227 3330). Please consider the environment before printing this email. CBRE respects your privacy. A copy of our Privacy Policy is available online. For California Residents, our California Privacy Notice is available here. If you have questions or concerns about our compliance with this policy, please email PrivacyAdministrator@cbre.com or write to Attn: Marketing Department, Privacy Administrator, CBRE, 200 Park Ave. 19-22 Floors, New York, NY 10166. Address: 415 Mission Street, Floor 46 Suite 700, San Francisco CA 94105
THIS IS A MARKETING COMMUNICATION © 2026 CBRE, Inc. All rights reserved. This information has been obtained from sources believed reliable but has not been verified for accuracy or completeness. CBRE, Inc. makes no guarantee, representation or warranty and accepts no responsibility or liability as to the accuracy, completeness, or reliability of the information contained herein. You should conduct a careful, independent investigation of the property and verify all information. Any reliance on this information is solely at your own risk. CBRE and the CBRE logo are service marks of CBRE, Inc. All other marks displayed on this document are the property of their respective owners, and the use of such logos does not imply any affiliation with or endorsement of CBRE. Photos herein are the property of their respective owners. Use of these images without the express written consent of the owner is prohibited.
|
|
|