|
|
|
DEMAND IN FOCUS
CONTINUE BETTING ON GROWTH IN PHOENIX
Phoenix’s multifamily market has delivered strong relative performance driven by robust employment growth and unprecedented economic diversification, elevated in-migration, and strong supply/demand fundamentals. Today, national headlines have shifted focus away from Phoenix’s strong demand drivers to the growing supply pipeline.
While the supply pipeline has expanded, it is important to recognize that the recent increase is in response to a historic housing shortage – Phoenix MSA underbuilt by ±81,000 units 2012-2022 – while population growth remains elevated. Multifamily deliveries peak in 2024, fall back to a more normalized annual completions schedule in 2025, and trend significantly downward in 2026 due to today’s current challenging capital markets environment.
Even with a relatively elevated pipeline, multiple third-party data resources are projecting a stable market occupancy of ±94% and a return to rent growth in 2024. As we navigate the current economic and capital markets environment, Phoenix is well-positioned to outperform as the region continues to demonstrate nation-leading growth and demand metrics.
|
 |
| Arcadia Cove |
Sale Date: August 2023
432 Total Units
Built in 1996 |
|
|  |
|
 |
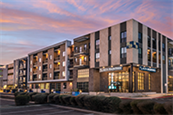
| Soltra at SanTan Village |
Sale Date: June 2023
380 Total Units
Built in 2022 |
|
| |
|
 |
| Alta Raintree |
Sale Date: June 2023
330 Total Units
Built in 2022 |
|
|
|
|---|
|
 |
| Clarendon Park |
Sale Date: July 2023
138 Total Units
Built in 2002 |
|
| |
|
 |
| Proximity Baseline (BTR) |
Sale Date: July 2023
80 Total Units
Built in 2023 |
|
| |
|
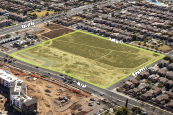 |
| Gilbert Pavilions (Land) |
Sale Date: July 2023
10.85 Total Acres |
|
|
|
|---|
|
|
| Exceptional Demand Absorbing Strong Multifamily Pipeline |
Phoenix led all U.S. markets in absorption through the first half of 2023 with 6,585 units of positive net absorption. The strong first half absorption in Phoenix is the second-highest first half total on record, further demonstrating the persistent demand and growth in the today’s market.
|
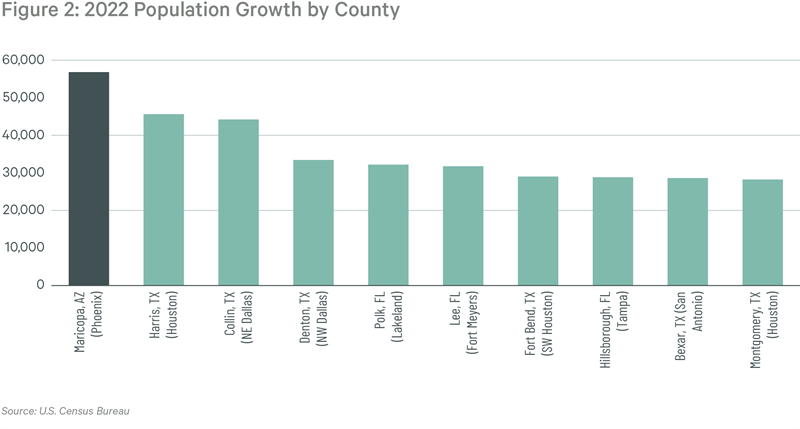
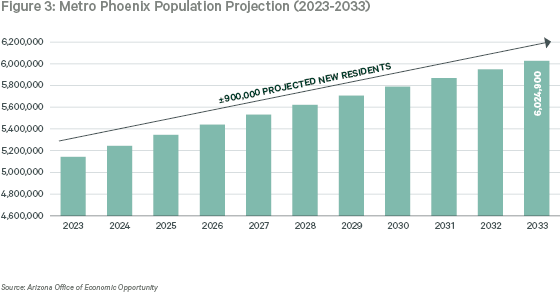
| Highest County Population Increase in U.S. |
Maricopa County had the highest population growth of all U.S. counties in 2022 with a net increase of ±57,000 residents. Maricopa County has been the country’s top net migration destination for five out of the last six years. The Phoenix Metro area (Maricopa County and Pinal County) was the fourth-fastest growing metro in the country with a net population increase of ±73,000 residents. Metro Phoenix population is projected to add ±900,000 new residents over the next 10 years and will top 6 million by 2033.
|
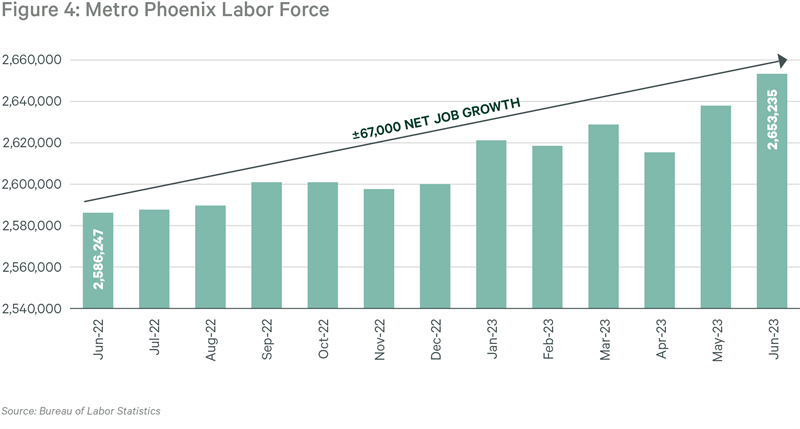
| Continued Employment Expansion |
Metro Phoenix added ±100,000 jobs from January to December 2022 and strong job growth continues into 2023. From June 2022 to June 2023, the Metro Phoenix labor force has expanded by ±67,000 net new jobs and large employment announcements for facilities currently under construction including TSMC (±4,500 direct jobs, ±17,500 total job impact), KORE (±3,000 jobs), Intel (±3,000 jobs), LG (±2,000 jobs), Banner Health (±2,500 jobs), and Mayo Clinic (±2,000 jobs) will further bolster employment expansion over the next several years.
|
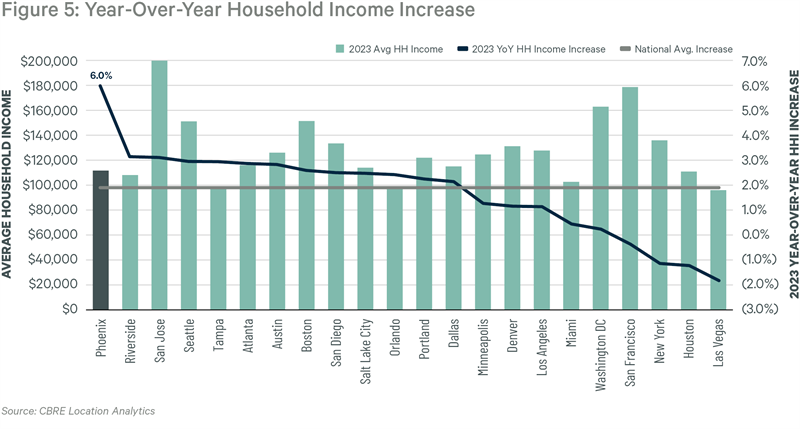
| Best Household Income Growth in U.S. |
Average household income across Metro Phoenix increased 6.0% from July 2022 to July 2023, the highest growth rate among large U.S. metros. Expansion in high paying industries including technology, semiconductor manufacturing, and healthcare, as well as the local economy’s shift from a back office hub to a destination for regional and corporate headquarters, are primary drivers of outsized income growth in Phoenix.
|
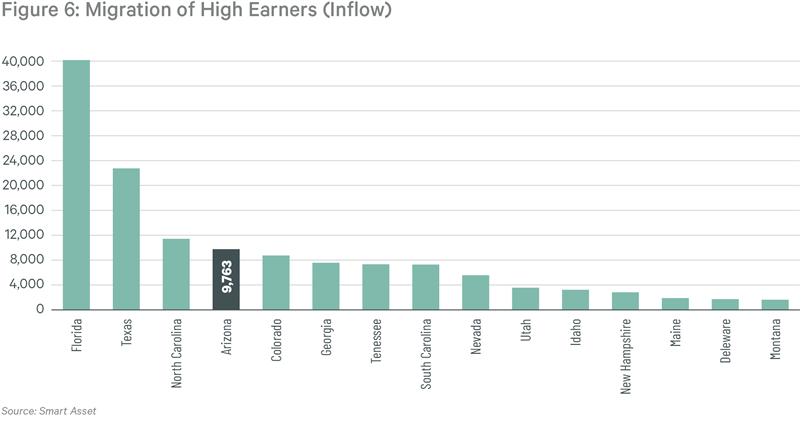
| Large Inflow of High-Income Earners |
The region’s nation-leading population growth included a large number of high-income professionals. Arizona had almost 10,000 new residents earning more than $200,000 a year move to the metro in 2022, the fourth highest total of all states with the majority of high income residents settling in Metro Phoenix.
|
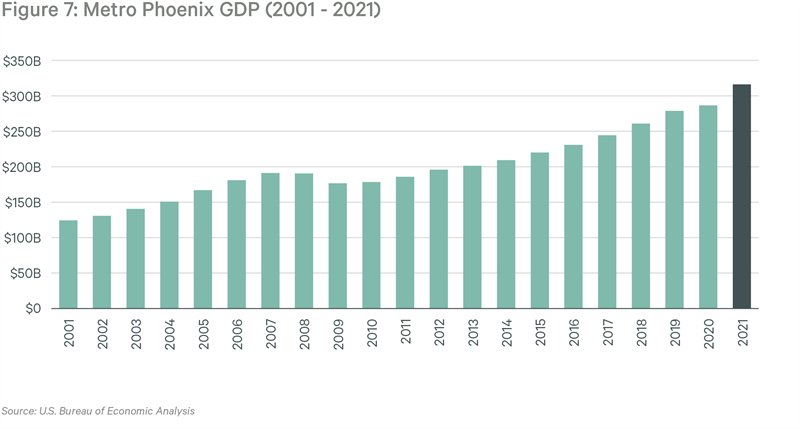
| GDP Expands at Twice the National Average |
Metro Phoenix gross domestic product has increased ±77% from 2010 to 2021 and has grown 7.7% since 2019, more than double the national average of 2.9% during the same time. Greater Phoenix accounts for over 75% of the 2021 Arizona GDP. This outsized growth is a result of continued economic diversification and historic foreign direct investment in the region.
|
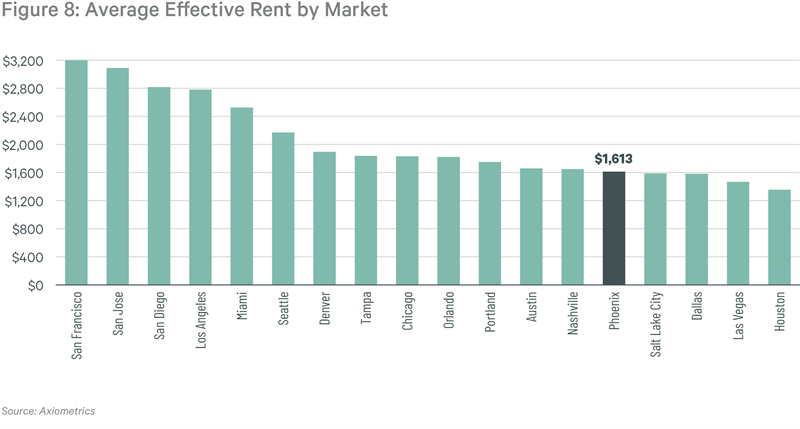
| Phoenix Average Rent Compared to Competitive Markets |
Phoenix has an exceptionally attractive average rent compared to many competitive markets. High rents in coastal markets, especially California, are driving strong migration to Phoenix. The metro’s comparatively affordable rent and cost of living present an appealing value proposition for professionals in more expensive markets. The formation of higher wage jobs and income will allow for continued rent growth while maintaining a relatively affordable rent to income ratio.
|
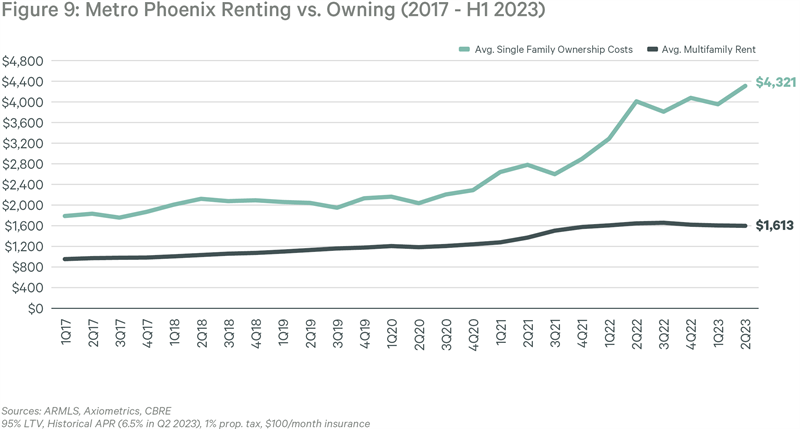
| Rising Barriers to Home Ownership |
While renting has remained relatively affordable in Phoenix (Rent-to-Income = 24%), homeownership has not. The monthly cost to own a single-family home in Phoenix is now on average 2.7x higher compared to renting. Home prices have continued to accelerate in 2023 (up 6.4% Y-o-Y as of July) and affordability is further compromised by persistently high mortgage rates. The unprecedented gap between renting and owning is resulting in more households entering the rental market, as evidenced by H2’23 net absorption performance. The strong economic drivers in Metro Phoenix positions the region for continued multifamily demand that will further stabilize occupancy, fuel rent growth, and absorb the much-needed new supply.
|
|
|
|
|
Unsubscribe
You may also unsubscribe by calling toll-free +1 877 CBRE 330 (+1 877 227 3330). Please consider the environment before printing this email. CBRE respects your privacy. A copy of our Privacy Policy is available online. For California Residents, our California Privacy Notice is available here. If you have questions or concerns about our compliance with this policy, please email PrivacyAdministrator@cbre.com or write to Attn: Marketing Department, Privacy Administrator, CBRE, 200 Park Ave. 19-22 Floors, New York, NY 10166. Address: 2575 E Camelback Rd Suite 500, Phoenix AZ 85016
THIS IS A MARKETING COMMUNICATION © 2026 CBRE, Inc. All rights reserved. This information has been obtained from sources believed reliable but has not been verified for accuracy or completeness. CBRE, Inc. makes no guarantee, representation or warranty and accepts no responsibility or liability as to the accuracy, completeness, or reliability of the information contained herein. You should conduct a careful, independent investigation of the property and verify all information. Any reliance on this information is solely at your own risk. CBRE and the CBRE logo are service marks of CBRE, Inc. All other marks displayed on this document are the property of their respective owners, and the use of such logos does not imply any affiliation with or endorsement of CBRE. Photos herein are the property of their respective owners. Use of these images without the express written consent of the owner is prohibited.
|
|
|