|
|
Francis | Ybarra | Moothart | Birrell | Santangelo | Korinek | Britt | Coleman | Grabher | Thorp | Post |
|
State of the Commercial Real Estate Debt Market
|
|
- Capital Availability and Cost of Capital: Our Team continues to access capital for virtually all property types and loan structures. Despite market uncertainties, there is a prevailing optimistic lending outlook heading into 2025. Capital sources continue to apply conservative underwriting standards and leverage. A common theme among many lenders is the desire to seek higher-yielding opportunities and they are willing to consider more “outside-the-box” deals to deploy these funds – with some lenders finally indicating their willingness to deploy capital into the right office market deals they’ve shied away from in more recent years. Life insurance company construction loan programs may offer higher initial loan proceeds and provide permanent loan terms of 7 years and beyond with a slight premium in spread. Also, with a continued constraint on bank construction lending coupled with equity for development remaining selective, participating debt has continued to be looked upon as a viable option.
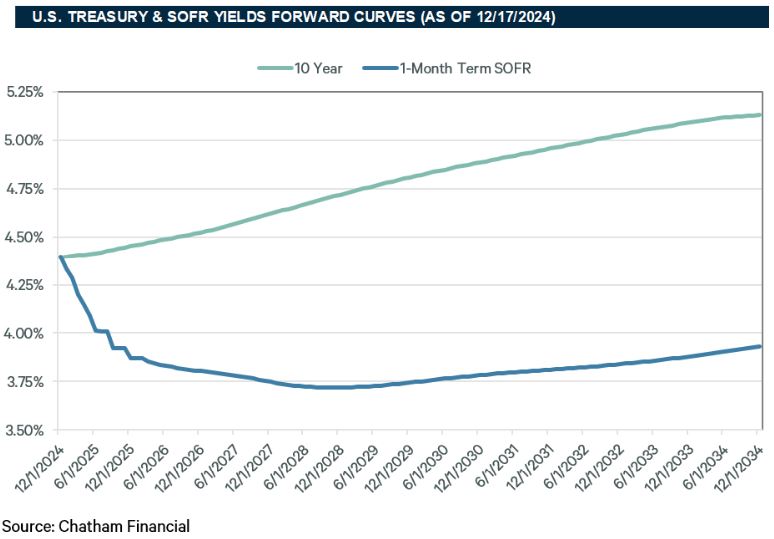
- Further Fed Interest Rate Cuts: The Fed’s interest rate cuts directly influence floating-rate mortgages tied to short-term rates like SOFR or Prime. However, fixed-rate mortgages are typically tied to Treasury bond yields which price in expectations of future Fed actions, the long-term economic outlook, and inflation forecasts, rather than just the outcomes of the next FOMC meeting. Despite market sentiment that interest rates are currently elevated, they are still well below the historic long-term average 10-Year US Treasury rate of 5.85% (since 1962). The Fed has already cut rates by 75 basis points between both the September and November meetings, with further cuts anticipated. CBRE’s house view is that there will be another 25 basis point reduction at December’s meeting followed by several more cuts in 2025. These future cuts will result in a lower SOFR yield with forward curves reflecting 3.75% by the end of 2025, 75 bps higher than previously contemplated just 90 days ago.
|
- Multifamily Development Trends: Most development deals don’t pencil today based on yield on cost metrics where equity would prefer to invest in acquiring lower risk existing product. Development starts have drastically dropped while recently delivered product is still at an elevated level. The number of units that began construction in the past two years is expected to hit a 40-year high, while construction starts are down 70% in 3Q 2024 from the recent peak in 1Q 2022. The cycle is projected to swing back over the next couple years as markets with high levels of new supply saw higher vacancy rates and rent declines. The expected drop-off in deliveries of new product will help stabilize both metrics. Those few developments that are able to move forward in the next 18 months will be delivering limited product into the rebounding markets at a time when vacancy rates are projected to be lower and rent growth is projected to be higher. The primary factors driving the decrease in construction starts has been higher financing rates, a pullback from traditional bank construction lending, and higher cap rates. We expect short-term rates (SOFR) to continue to drop as the Fed continues monetary easing, helping select development deals to pencil, again. This is further supported by the end of a three-year rise in vacancy rates with those recently developed apartments starting to fill up, with demand for apartments reaching its highest levels since 2021.
|
- “Extend and Pretend” Likely Coming to an End for Certain Borrowers: This tactic utilized by lenders has led to an absence of significant foreclosures and loan defaults in the recent real estate downcycle. The assumption that medium- and long-term rates would continue to drop and stabilize those troubled assets has not come to fruition as treasury rates remain elevated. Those assets that are reaching the end of their extension periods have pushed a wall of loan maturities to new heights, with the NY Fed estimating what was once a 3-year maturity window (as of 4Q 2020) representing 16% of bank mark-to-market capital has now ballooned to a 3-year maturity window (as of 4Q 2023) representing 27% of bank capital, effectively allowing banks to delay the recognition of losses on potentially distressed mortgages. Banks hold 50.7% of the $5.8 trillion commercial real estate market as of 4Q 2023. This growing near-term maturity wall has crept up to approximately $2.0 trillion in mortgages set to mature by year-end 2026. Today’s higher interest rates, lower valuations, and operational challenges will test borrower’s abilities to navigate their options. Borrowers in good standing and those who are able to bring more equity to the table should be better positioned to work through extension options with their existing lenders or navigate the market to seek refinancing options.
|
|
|
Current Index Rates and Trends
|
|
The below matrix compares key index rates over the last 12 months as of 12/16/2024. The mid- and long-term US Treasury yield curve is fairly flat, albeit positively sloped. The relatively high rates at the short end of the curve may be an indication that the markets are not comfortable with the prospects for near term inflation, and they do not support the idea that a recession is on the horizon. |
|
INDEX
|
AS OF 12/16/24
|
AS OF 9/17/24
|
AS OF 12/18/23
|
12-MO. CHANGE
|
|---|
|
10-YR US Treasury
|
4.41%
|
3.66%
|
3.94%
|
0.47%
| |
7-YR US Treasury
|
4.33%
|
3.55%
|
3.97%
|
0.37%
| |
5-YR US Treasury
|
4.26%
|
3.45%
|
3.94%
|
0.32%
| |
3-YR US Treasury
|
4.24%
|
3.47%
|
4.16%
|
0.08%
| |
6-MO US Treasury
|
4.32%
|
4.56%
|
5.33%
|
-1.01%
| |
*SOFR-NY FED-30-DAY TERM
|
4.38%
|
5.38%
|
5.32%
|
-0.94%
|
|
|
|
|
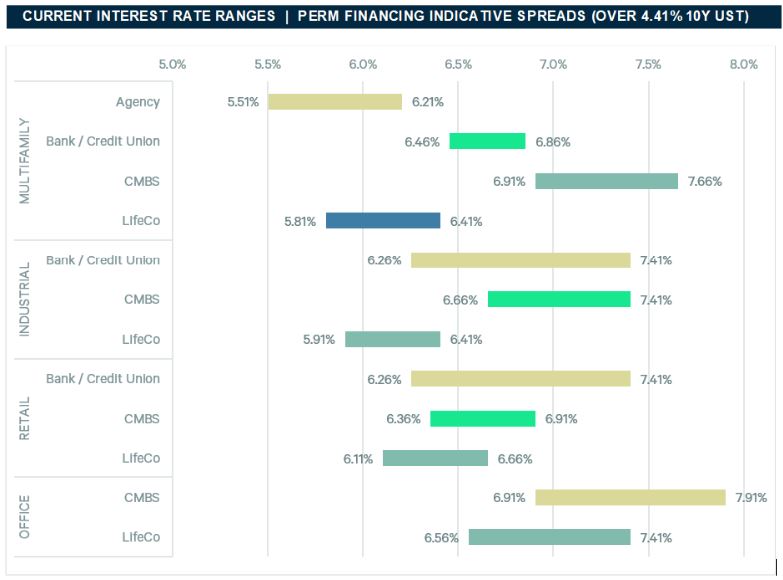
The below matrix compares fixed rate permanent financing pricing by property and lender type as of 12/16/2024, based on an assumed 10-year UST index rate of 4.41%. Please reach out to a producer for specific deal terms.
|
|
Source: CBRE Debt & Structured Finance recently quoted deals (Agency pricing represents conventional-sized deals at $7.5M+).
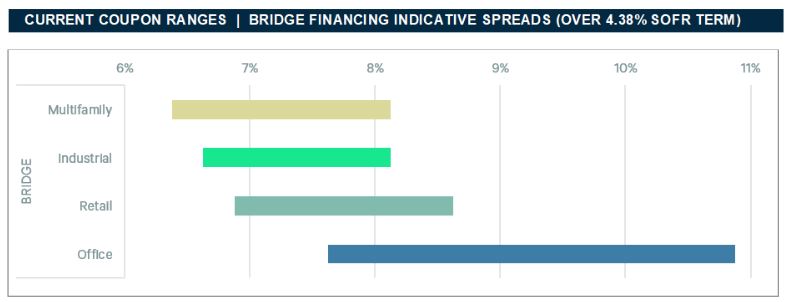
The below matrix compares floating rate bridge financing pricing by property type as of 12/16/2024, based on an assumed 30-Day Term SOFR index rate of 4.38%. Please reach out to a producer for specific deal terms.
|
Source: CBRE Debt & Structured Finance recently quoted deal |
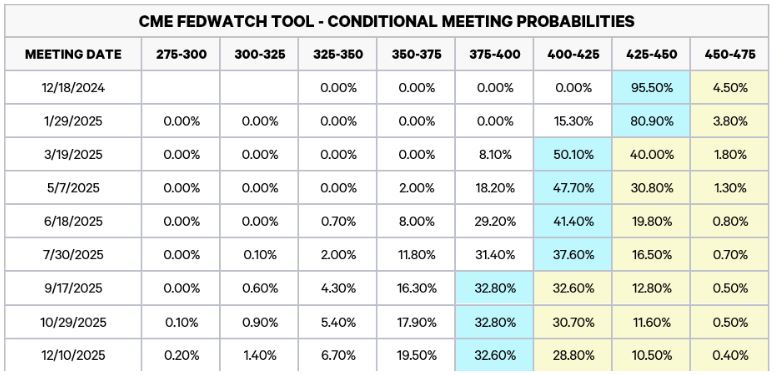
| FEDERAL FUNDS RATE CUT PROBABILITY |
The below chart tracks the probabilities of changes to the Fed target rate and U.S. monetary policy according to interest rate traders, as implied by 30-Day Fed Funds futures pricing data.
|
|
The below chart shows current SOFR and 10-Year Treasury Index forward curves which can be useful for forecasting, but should not be viewed as predictive of actual future interest rates. UST forward curves represent future yields based on observable market data (futures contracts, market swap rates, and current outstanding Treasury Instruments), while the SOFR forward curve represents market-implied future setting for 1-Month Term SOFR.
|
Fed’s Kashkari: Interest Rate Cut in December is ’Reasonable’
Neel Kashkari, President of the Federal Reserve Bank of Minneapolis, known for his typically hawkish stance, indicated that a December interest-rate cut is a reasonable consideration. The Fed has been cutting rates since September due to easing inflation and concerns over high borrowing costs affecting the job market. However, the progress towards the Fed's 2% inflation goal has slowed, leading to continued discussions on the appropriate level for the policy rate currently set at 4.75%-5.00%. Kashkari aims to understand the impact of borrowing costs on the economy and inflation trends. Upcoming reports on inflation and the job market will be crucial for the Fed's decision during their next meeting on December 17-18.
CRE Market Already Feeling Election Impacts
The commercial real estate (CRE) market is already feeling the effects of the recent presidential election, particularly with the Republican trifecta victory. Three key Republican policies that could impact the CRE market include the renewal of the 2017 Tax Cuts and Jobs Act, broad-based trade tariffs, and changes in immigration policies. The anticipation of these policies has already influenced interest rates, with the 10-year treasury climbing about 70 basis points since early October. This rise in interest rates affects the cost of CRE financing and brings into question the likelihood of Federal Reserve rate reductions. Despite uncertainties, long-term demand drivers for CRE remain strong, supported by factors such as a housing shortage and robust consumer financial positions.
What’s Ahead for the GSEs Under the New Administration?
Under the potential second term of President Trump, there is a renewed discussion on privatizing Fannie Mae and Freddie Mac (GSEs) and exiting conservatorship. This process is expected to be complex and lengthy and involves various stakeholders including the Treasury Department, Federal Housing Finance Agency (FHFA), and potentially Congress. Past efforts have failed, but current discussions revolve around selling the government's stakes in the GSEs and renegotiating the Preferred Stock Purchase Agreements (PSPAs). Key considerations include maintaining affordable housing goals, ensuring sufficient capitalization, and securing a federal government backstop for mortgage-backed securities. The Mortgage Bankers Association and National Multifamily Housing Council emphasize the need for careful planning and stakeholder involvement throughout this process. Ensuring a permanent federal government backstop for mortgage-backed securities is vital for investor confidence.
CRE Lending Volume Increases 59% Year-Over-Year
CRE lending in Q3 was up 59% over 2023 and up 44% over Q2 2024 as tracked by the Mortgage Bankers Association (MBA). Loan volume increased across almost all property types, with hotel loans doubling, and healthcare loans up 510%. This was primarily driven by the temporary drop on the 10-Year Treasury yield that averaged 3.72% in September and dipped as low as 3.62%; however, Treasury rates have since climbed back up into the 4%-range.
Americas Empty Apartments Are Finally Starting to Fill Up
The vacancy rate for apartments in the U.S. has halted its three-year rise, with demand for apartments reaching its highest levels since 2021. Over 1.2 million new apartment units built in the past two years are beginning to fill up, potentially giving landlords more pricing power to raise rents if the demand continues. Sales of apartment buildings have also increased as investor confidence grows. However, housing affordability remains a significant political issue, and any rent increases could pressure the government to address housing costs. Major cities, especially those with increased office return policies, are seeing higher demand, while cities like Austin face high vacancy rates and slow rent growth. Elevated Treasury rates mean continued high home loan rates which will keep most tenants as renters for longer.
Office Sector Turns in Strongest Leasing Quarter in Five Years
The office leasing market experienced its strongest quarter in five years during Q3 2024, driven by improved return-to-office metrics and solid economic growth. Suburban markets saw increased leasing activity while urban centers struggled with high availability rates. There is continued demand for well-located, high-end office spaces, with Class A rents stabilizing. Sublease space has decreased for the fourth consecutive quarter. Office inventory is shrinking in some areas due to conversions and redevelopment, while other regions, particularly in the Sun Belt and Texas, are seeing growth. Investment sales in the office sector have remained muted with 57% less volume than YTD 2022, with cap rates averaging 7.3% vs. 6.8% pre-pandemic.
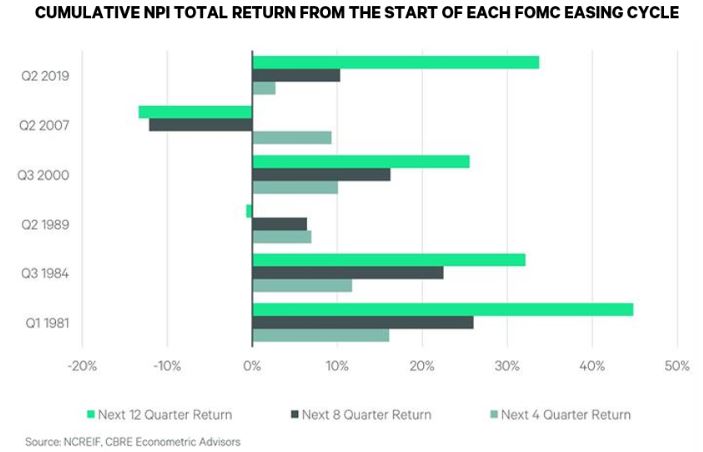
What Could be in Store for Commercial Real Estate
Historical real estate total returns have been positive in the periods following the start of a new rate-cutting cycle – see chart below. The expected benefit from a reduction in rates is likely to be enhanced by a resilient economy and continued NOI growth.
|
We expect the 10-Year Treasury to remain in the low-to-mid-4% range, as opposed to forecasts in the sub-4% range from a few months ago. We expect transaction volume to increase – both due to confirmed expectations in the political landscape and seemingly steady economic metrics indicating a reduced likelihood for recession. Newly stabilized developments are either going to hit the sale market or accept likely lower LTV’s and cash-neutral to cash-in perm take out refinancings. We expect more groups to transact – either dispositions or refinancings – as they can no longer kick the can down the road given the expected continuance of an elevated rate environment.
Despite long-term [index] interest rates above 4% continuing to weigh on investment activity while the Fed continues to lower short-term interest rates, we are still seeing improvement in the market. Consensus GDP growth estimates for both year-end 2024 and 2025 have been revised higher to approximately 2.0% supported by a forecasted rebound in the currently cooled labor market. Layoffs are currently low and net job growth continues, and inflation has all but stabilized.
Our Team is actively seeking the most accretive financing solutions in the market across a broad range of lender and product types. We are consistently achieving the best possible outcomes for our Clients’ commercial real estate financing needs. |
|
 |
|
|
Unsubscribe
You may also unsubscribe by calling toll-free +1 877 CBRE 330 (+1 877 227 3330). Please consider the environment before printing this email. CBRE respects your privacy. A copy of our Privacy Policy is available online. For California Residents, our California Privacy Notice is available here. If you have questions or concerns about our compliance with this policy, please email PrivacyAdministrator@cbre.com or write to Attn: Marketing Department, Privacy Administrator, CBRE, 200 Park Ave. 19-22 Floors, New York, NY 10166. Address: 4301 La Jolla Village Drive Suite 3000 Suite 700, San Diego CA 92122
THIS IS A MARKETING COMMUNICATION © 2025 CBRE, Inc. All rights reserved. This information has been obtained from sources believed reliable but has not been verified for accuracy or completeness. CBRE, Inc. makes no guarantee, representation or warranty and accepts no responsibility or liability as to the accuracy, completeness, or reliability of the information contained herein. You should conduct a careful, independent investigation of the property and verify all information. Any reliance on this information is solely at your own risk. CBRE and the CBRE logo are service marks of CBRE, Inc. All other marks displayed on this document are the property of their respective owners, and the use of such logos does not imply any affiliation with or endorsement of CBRE. Photos herein are the property of their respective owners. Use of these images without the express written consent of the owner is prohibited.
|
|
|