|
|
 |
|
 |
 |
|
| GREATER LOS ANGELES MARKETFLASH | |
|
|
|
|
|
|
 |
| LA's Office Re-Entry Slows Despite Signs of Strength in Demand |
|
 |
|
|
| After California embraced a widespread reopening in the summer, the increasing prevalence of the Delta variant has introduced new uncertainty for regional occupiers’ return to work plans. According to Kastle Systems, which measures the number of times keycards and fobs are used by employees to enter an office space, LA office occupancy had climbed 900 basis points from its lowest level in January 2021 to 30% in early July. Since then, the climb in physical occupancy rates has reversed. As of Aug. 18, LA’s office occupancy stands at 27.7%, a 200 bps decline from just the month prior. Looking at the same period the year before shows that fewer people are heading back in LA—a stark contrast compared to other major metros across the county. In metros where social distancing guidelines are less stringent, such as Houston, Dallas-Fort Worth, and Austin, office occupancy has risen back to over 46%. | |
|
|
|
| Data from Kastle Systems showed the number of people coming back to the office in LA was gradually increasing over the summer, but new COVID cases threaten to dampen the return to in-person work. |
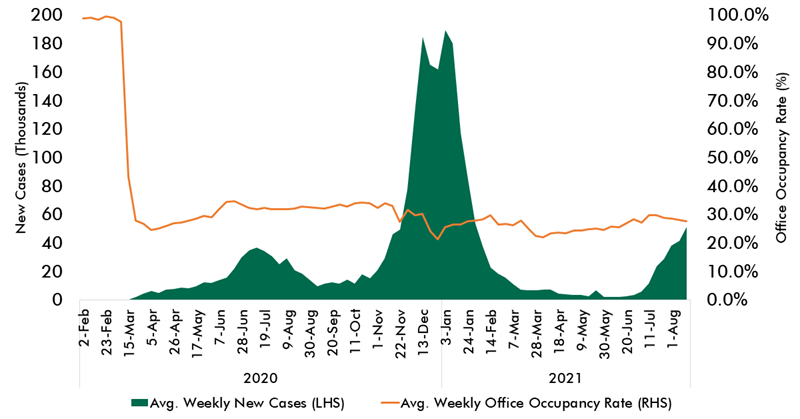 |
| Source: CDC; Kastle Systems; CBRE Research, 2021. |
| |
|
|
|
| LA lags behind other major metros in employees returning to the office, especially compared to last year. |
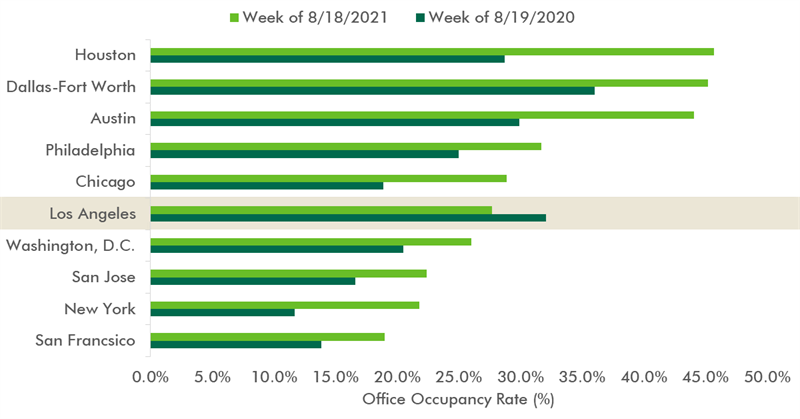 |
| Source: Kastle Systems; CBRE Research, 2021. |
| |
|
|
|

Engage your clients and colleagues directly by sharing this report via your social network. |
| |
|
|
|
|
|
|
|
 |
Unsubscribe
You may also unsubscribe by calling toll-free +1 877 CBRE 330 (+1 877 227 3330). Please consider the environment before printing this email. CBRE respects your privacy. A copy of our Privacy Policy is available online. For California Residents, our California Privacy Notice is available here. If you have questions or concerns about our compliance with this policy, please email PrivacyAdministrator@cbre.com or write to Attn: Marketing Department, Privacy Administrator, CBRE, 200 Park Ave. 19-22 Floors, New York, NY 10166. Address: 4141 Inland Empire Blvd., #100 Suite 700, Ontario CA 91764 © 2026 CBRE Statistics contained herein may represent a different data set than that used to generate National Vacancy and Availability Index statistics published by CBRE Corporate Communications or CBRE's research and econometric forecasting unit, CBRE Econometric Advisors. Information herein has been obtained from sources believed reliable. While we do not doubt its accuracy, we have not verified it and make no guarantee, warranty or representation about it. It is your responsibility to independently confirm its accuracy and completeness. Any projections, opinions, assumptions or estimates used are for example only and do not represent the current or future performance of the market. This information is designed exclusively for use by CBRE clients, and cannot be reproduced without prior written permission of CBRE. CBRE and the CBRE logo are service marks of CBRE, Inc. All other marks displayed on this document are the property of their respective owners, and the use of such logos does not imply any affiliation with or endorsement of CBRE. Photos herein are the property of their respective owners. Use of these images without the express written consent of the owner is prohibited.
|
All of CBRE's COVID-19 related materials have been developed with information from the World Health Organization, the Centers for Disease Control & Prevention (and similar global organizations), public health experts, industrial hygienists, and global subject matter experts across CBRE and our strategic suppliers. Our materials may not be suitable for application to all facilities or situations.
Ultimately, occupiers and landlords must make and implement their own reopening decisions for their individual stakeholders and facilities. CBRE's guidance is intended to help facilitate those discussions and expedite the implementation of those decisions once made by the client. We make no representations or warranties regarding the accuracy or completeness of these materials. CBRE cannot ensure safety and disclaims all liability arising from use of these materials.
|
|
|
|